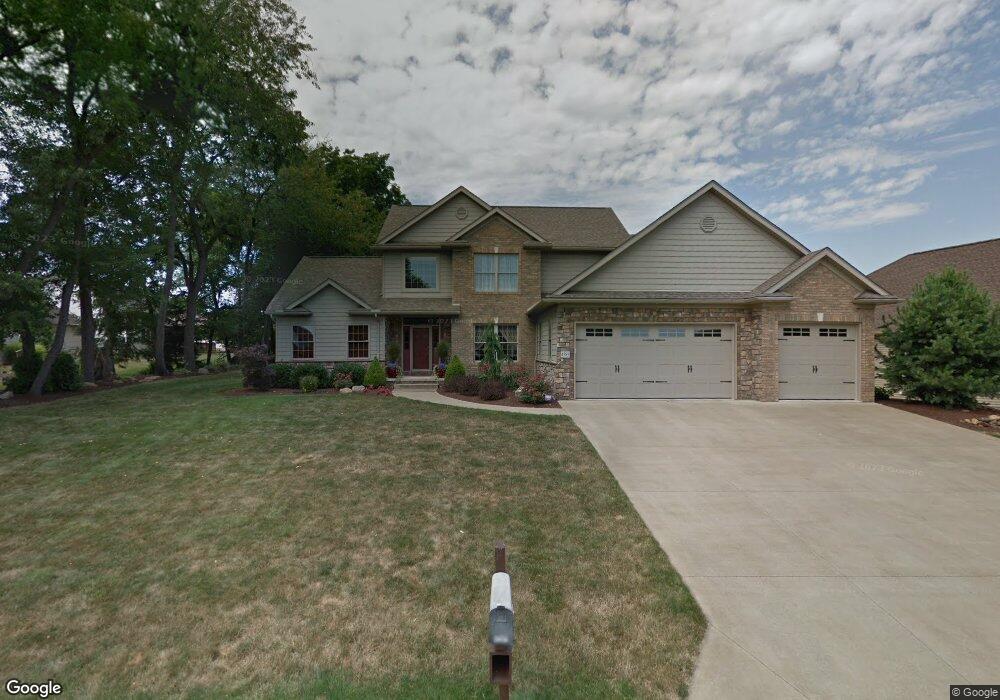
4585 Ranier Ave NW Massillon, OH 44646
Amherst Heights-Clearview NeighborhoodEstimated Value: $473,000 - $556,000
3
Beds
3
Baths
2,181
Sq Ft
$228/Sq Ft
Est. Value
About This Home
This home is located at 4585 Ranier Ave NW, Massillon, OH 44646 and is currently estimated at $496,483, approximately $227 per square foot. 4585 Ranier Ave NW is a home located in Stark County with nearby schools including Sauder Elementary School, Jackson Memorial Middle School, and Jackson High School.
Ownership History
Date
Name
Owned For
Owner Type
Purchase Details
Closed on
Dec 19, 2019
Sold by
Crisp Gary A and Crisp Gina
Bought by
Walters Katlynn S
Current Estimated Value
Home Financials for this Owner
Home Financials are based on the most recent Mortgage that was taken out on this home.
Original Mortgage
$235,000
Outstanding Balance
$207,186
Interest Rate
3.6%
Mortgage Type
New Conventional
Estimated Equity
$289,297
Purchase Details
Closed on
Oct 2, 2017
Sold by
Ramold Gerald C and Ramold Carrie Ann
Bought by
Crisp Gary A and Crisp Gina
Home Financials for this Owner
Home Financials are based on the most recent Mortgage that was taken out on this home.
Original Mortgage
$271,600
Interest Rate
3.89%
Mortgage Type
New Conventional
Purchase Details
Closed on
Jul 30, 2008
Sold by
Oakes Galen M and Oakes Beulah L
Bought by
Ramold Gerald C and Ramold Carrie Ann
Home Financials for this Owner
Home Financials are based on the most recent Mortgage that was taken out on this home.
Original Mortgage
$204,000
Interest Rate
6.5%
Mortgage Type
Construction
Create a Home Valuation Report for This Property
The Home Valuation Report is an in-depth analysis detailing your home's value as well as a comparison with similar homes in the area
Home Values in the Area
Average Home Value in this Area
Purchase History
| Date | Buyer | Sale Price | Title Company |
|---|---|---|---|
| Walters Katlynn S | $335,000 | None Available | |
| Crisp Gary A | $339,500 | None Available | |
| Ramold Gerald C | $64,000 | Attorney |
Source: Public Records
Mortgage History
| Date | Status | Borrower | Loan Amount |
|---|---|---|---|
| Open | Walters Katlynn S | $235,000 | |
| Previous Owner | Crisp Gary A | $271,600 | |
| Previous Owner | Ramold Gerald C | $204,000 |
Source: Public Records
Tax History Compared to Growth
Tax History
| Year | Tax Paid | Tax Assessment Tax Assessment Total Assessment is a certain percentage of the fair market value that is determined by local assessors to be the total taxable value of land and additions on the property. | Land | Improvement |
|---|---|---|---|---|
| 2025 | -- | $148,020 | $31,290 | $116,730 |
| 2024 | -- | $148,020 | $31,290 | $116,730 |
| 2023 | $6,161 | $123,420 | $28,950 | $94,470 |
| 2022 | $6,130 | $123,420 | $28,950 | $94,470 |
| 2021 | $6,154 | $123,420 | $28,950 | $94,470 |
| 2020 | $5,664 | $104,380 | $24,960 | $79,420 |
| 2019 | $5,456 | $104,380 | $24,960 | $79,420 |
| 2018 | $5,483 | $104,380 | $24,960 | $79,420 |
| 2017 | $5,109 | $92,510 | $23,100 | $69,410 |
| 2016 | $5,190 | $93,350 | $23,100 | $70,250 |
| 2015 | $5,253 | $93,350 | $23,100 | $70,250 |
| 2014 | $1,015 | $85,230 | $21,070 | $64,160 |
| 2013 | $2,467 | $85,230 | $21,070 | $64,160 |
Source: Public Records
Map
Nearby Homes
- 4456 Red Panda Cir NW
- 8459 Audubon St NW
- 4804 Ranier Ave NW
- 8325 Condor Cir NW
- 8572 Yorkshire St NW
- 8251 Audubon St NW
- 8673 Dublin Ridge Cir NW Unit 4A
- 8555 Esquire St NW
- 8309 Gentry St NW
- 8798 Stoneshire St NW
- 4213 Columbia Ave NW
- 4195 Columbia Ave NW
- 4792 Revere Ave NW
- 7978 Parkford St NW
- 8484 Traphagen St NW
- 5271 Lake Vista Cir NW
- 4428 Trail Head Cir NW
- 4338 Greenway Trail St NW Unit 36
- 4374 Forest Glen Ave NW Unit 8
- 0 Cambridge St NW
- 4607 Ranier Ave NW
- 8465 Noble Loon St NW
- 8487 Noble Loon St NW
- 8436 Windy Hill Cir NW
- 8437 Noble Loon St NW
- 8437 Windy Hill Cir NW
- 8505 Noble Loon St NW
- 8424 Windy Hill Cir NW
- 4643 Ranier Ave NW
- 8415 Noble Loon St NW
- 8523 Noble Loon St NW
- 8464 Noble Loon St NW
- 8420 Windy Hill Cir NW
- 8486 Noble Loon St NW
- 8425 Windy Hill Cir NW
- 4520 Ranier Ave NW
- 4659 Ranier Ave NW
- 8452 Wooded Point Cir NW
- 8504 Noble Loon St NW
- 8397 Noble Loon St NW