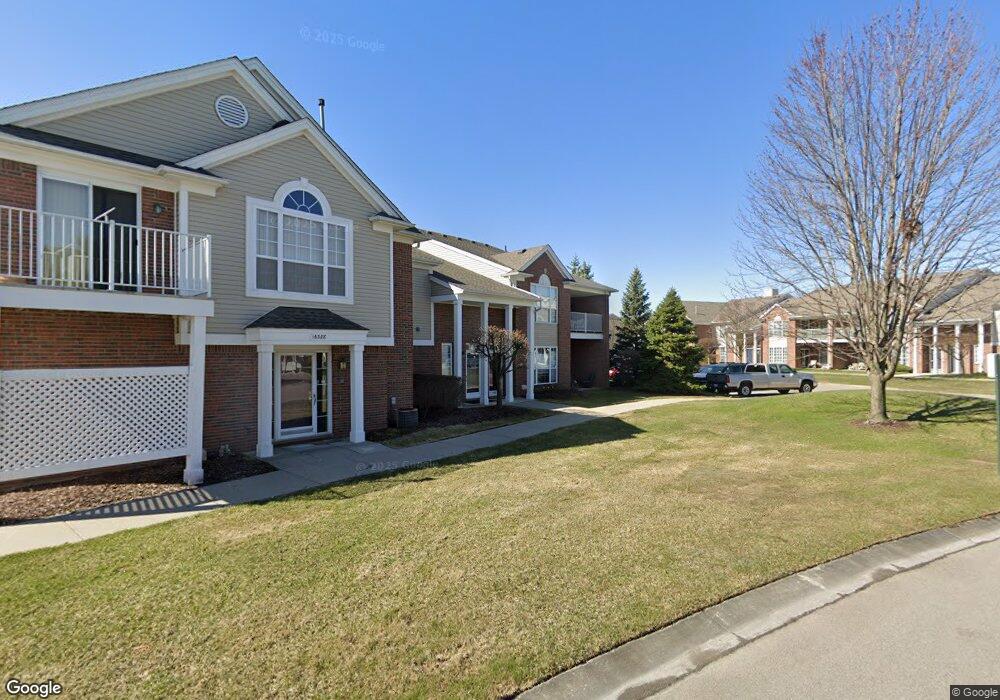
45850 Warwick Dr Unit 2 Macomb, MI 48044
Estimated Value: $229,000 - $232,000
2
Beds
2
Baths
1,632
Sq Ft
$141/Sq Ft
Est. Value
About This Home
This home is located at 45850 Warwick Dr Unit 2, Macomb, MI 48044 and is currently estimated at $230,429, approximately $141 per square foot. 45850 Warwick Dr Unit 2 is a home located in Macomb County with nearby schools including Fox Elementary School, Iroquois Middle School, and Chippewa Valley High School.
Ownership History
Date
Name
Owned For
Owner Type
Purchase Details
Closed on
Jul 13, 2011
Sold by
Stagle Michelle
Bought by
Stephens Crystin A
Current Estimated Value
Purchase Details
Closed on
Mar 18, 2011
Sold by
Slagle Michelle L
Bought by
Federal National Mortgage Association
Purchase Details
Closed on
Aug 18, 2005
Sold by
Vitale James and Vitale Dana
Bought by
Slagle Michelle L
Home Financials for this Owner
Home Financials are based on the most recent Mortgage that was taken out on this home.
Original Mortgage
$144,400
Interest Rate
5.87%
Mortgage Type
Fannie Mae Freddie Mac
Purchase Details
Closed on
Apr 15, 2002
Sold by
Warwick Village Llc
Bought by
Vitale James
Home Financials for this Owner
Home Financials are based on the most recent Mortgage that was taken out on this home.
Original Mortgage
$91,764
Interest Rate
7.13%
Mortgage Type
Purchase Money Mortgage
Create a Home Valuation Report for This Property
The Home Valuation Report is an in-depth analysis detailing your home's value as well as a comparison with similar homes in the area
Home Values in the Area
Average Home Value in this Area
Purchase History
| Date | Buyer | Sale Price | Title Company |
|---|---|---|---|
| Stephens Crystin A | $77,320 | Liberty Title | |
| Federal National Mortgage Association | $135,826 | None Available | |
| Slagle Michelle L | $152,000 | Greco | |
| Vitale James | $141,764 | -- |
Source: Public Records
Mortgage History
| Date | Status | Borrower | Loan Amount |
|---|---|---|---|
| Previous Owner | Slagle Michelle L | $144,400 | |
| Previous Owner | Vitale James | $91,764 |
Source: Public Records
Tax History
| Year | Tax Paid | Tax Assessment Tax Assessment Total Assessment is a certain percentage of the fair market value that is determined by local assessors to be the total taxable value of land and additions on the property. | Land | Improvement |
|---|---|---|---|---|
| 2025 | $1,344 | $117,400 | $0 | $0 |
| 2024 | $13 | $110,600 | $0 | $0 |
| 2023 | $1,240 | $96,100 | $0 | $0 |
| 2022 | $1,540 | $88,900 | $0 | $0 |
| 2021 | $1,498 | $83,700 | $0 | $0 |
| 2020 | $1,137 | $80,200 | $0 | $0 |
| 2019 | $1,386 | $69,100 | $0 | $0 |
| 2018 | $1,357 | $67,000 | $0 | $0 |
| 2017 | $1,329 | $65,490 | $9,250 | $56,240 |
| 2016 | $1,261 | $65,480 | $0 | $0 |
| 2015 | $1,245 | $60,350 | $0 | $0 |
| 2014 | $1,245 | $43,110 | $6,250 | $36,860 |
| 2011 | $268 | $45,490 | $5,250 | $40,240 |
Source: Public Records
Map
Nearby Homes
- 16431 Dominion Dr Unit 235
- 45640 Warwick Dr Unit 37
- 45691 Heather Ridge Dr Unit 221
- 45679 Heather Ridge Dr Unit 216
- 46101 Allenton Dr
- 17014 Newbury Ave Unit 93
- 17025 Crosbydale St
- 17008 Dalworth St Unit 107
- 17115 Scarborough Dr Unit 562
- 45530 Meadows Square Unit 9
- 45529 Essex Dr
- 46784 Country Ln Unit 18
- 46980 Country Ln Unit 8
- 46813 Fox Run Dr
- 15530 Ashley Ct
- 15511 Huntcliff Dr
- 47192 Sanborn Dr
- 44643 Connecticut Ct
- 15895 Cambridge Dr Unit 1
- 15739 Revere Dr Unit 190
- 45802 Warwick Dr Unit Bldg-Unit
- 45820 Warwick Dr
- 45814 Warwick Dr Unit 11
- 45808 Warwick Dr
- 45802 Warwick Dr
- 45796 Warwick Dr Unit 8
- 45844 Warwick Dr Unit 3
- 45856 Warwick Dr Unit 1
- 45802 Warwick Dr Unit 9
- 45814 Warwick Dr
- 45832 Warwick Dr Unit 5
- 45790 Warwick Dr
- 45826 Warwick Dr Unit 6
- 16532 Radison Dr
- 45760 Warwick Dr Unit Bldg-Unit
- 45736 Warwick Dr
- 45754 Warwick Dr
- 45748 Warwick Dr Unit 24
- 45742 Warwick Dr
- 45766 Warwick Dr
Your Personal Tour Guide
Ask me questions while you tour the home.