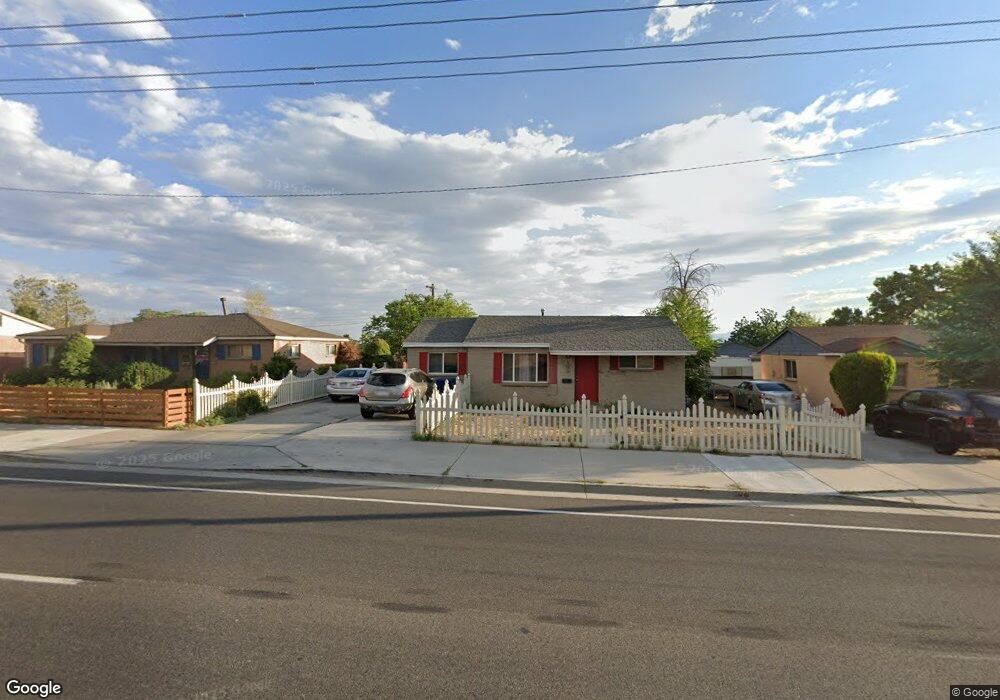
4586 W 5415 S Salt Lake City, UT 84118
Estimated Value: $365,000 - $405,000
4
Beds
1
Bath
1,225
Sq Ft
$311/Sq Ft
Est. Value
About This Home
This home is located at 4586 W 5415 S, Salt Lake City, UT 84118 and is currently estimated at $380,656, approximately $310 per square foot. 4586 W 5415 S is a home located in Salt Lake County with nearby schools including West Kearns Elementary School, Kearns Jr High School, and Kearns High School.
Ownership History
Date
Name
Owned For
Owner Type
Purchase Details
Closed on
Jul 10, 2019
Sold by
Gomes Dartagnan M
Bought by
Sitze David N
Current Estimated Value
Home Financials for this Owner
Home Financials are based on the most recent Mortgage that was taken out on this home.
Original Mortgage
$172,500
Outstanding Balance
$151,373
Interest Rate
3.9%
Mortgage Type
New Conventional
Estimated Equity
$229,283
Purchase Details
Closed on
Mar 3, 2017
Sold by
Breckenridge Property Fund 2016 Llc
Bought by
Gomes Dartagnan M
Home Financials for this Owner
Home Financials are based on the most recent Mortgage that was taken out on this home.
Original Mortgage
$115,757
Interest Rate
4.19%
Mortgage Type
New Conventional
Purchase Details
Closed on
Sep 16, 2016
Sold by
Anderson Cindee
Bought by
Breckenridg Eproperty Fund 2016 Llc
Purchase Details
Closed on
Sep 28, 2011
Sold by
Atkinson Norma
Bought by
Utah Department Of Transportation
Create a Home Valuation Report for This Property
The Home Valuation Report is an in-depth analysis detailing your home's value as well as a comparison with similar homes in the area
Home Values in the Area
Average Home Value in this Area
Purchase History
| Date | Buyer | Sale Price | Title Company |
|---|---|---|---|
| Sitze David N | -- | Security Title Ins Agency | |
| Gomes Dartagnan M | -- | Security Title Ins Agency | |
| Breckenridg Eproperty Fund 2016 Llc | -- | Inwest Title Services | |
| Utah Department Of Transportation | -- | None Available |
Source: Public Records
Mortgage History
| Date | Status | Borrower | Loan Amount |
|---|---|---|---|
| Open | Sitze David N | $172,500 | |
| Previous Owner | Gomes Dartagnan M | $115,757 |
Source: Public Records
Tax History Compared to Growth
Tax History
| Year | Tax Paid | Tax Assessment Tax Assessment Total Assessment is a certain percentage of the fair market value that is determined by local assessors to be the total taxable value of land and additions on the property. | Land | Improvement |
|---|---|---|---|---|
| 2025 | $2,270 | $324,500 | $60,100 | $264,400 |
| 2024 | $2,270 | $305,600 | $56,500 | $249,100 |
| 2023 | $2,108 | $272,600 | $54,300 | $218,300 |
| 2022 | $2,143 | $284,600 | $53,200 | $231,400 |
| 2021 | $1,972 | $237,100 | $40,900 | $196,200 |
| 2020 | $1,820 | $204,500 | $37,300 | $167,200 |
| 2019 | $1,721 | $191,300 | $35,200 | $156,100 |
| 2018 | $1,623 | $174,100 | $35,200 | $138,900 |
| 2017 | $1,339 | $150,400 | $35,200 | $115,200 |
| 2016 | $1,134 | $127,600 | $32,400 | $95,200 |
| 2015 | $701 | $92,200 | $39,600 | $52,600 |
| 2014 | $927 | $83,800 | $36,700 | $47,100 |
Source: Public Records
Map
Nearby Homes