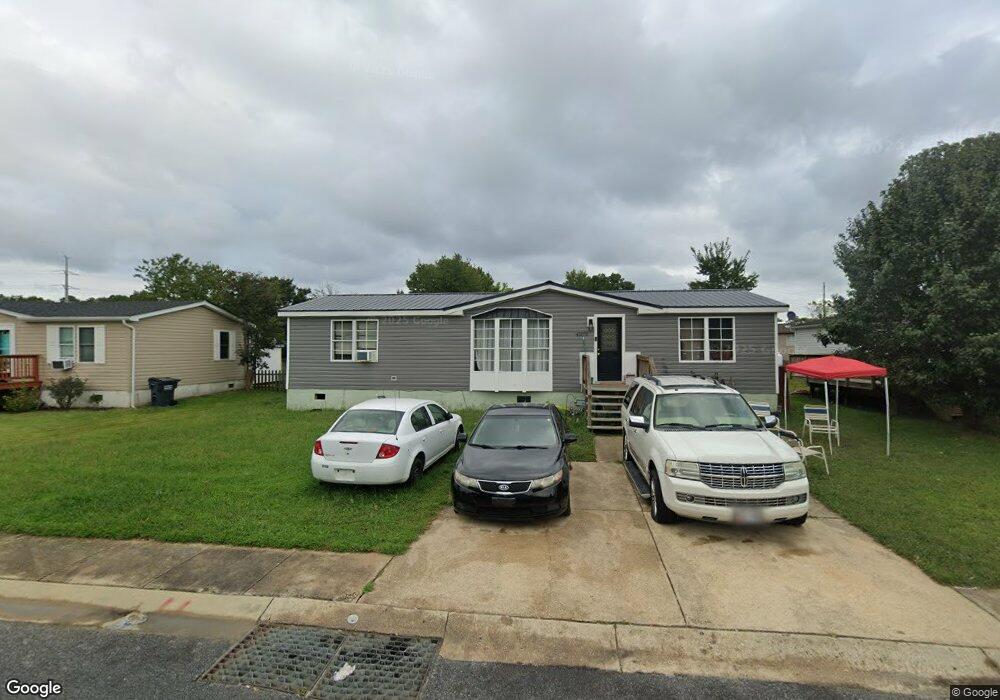
45870 N Poteat Ct California, MD 20619
Estimated Value: $190,000 - $257,000
3
Beds
2
Baths
1,248
Sq Ft
$190/Sq Ft
Est. Value
About This Home
This home is located at 45870 N Poteat Ct, California, MD 20619 and is currently estimated at $237,714, approximately $190 per square foot. 45870 N Poteat Ct is a home located in St. Mary's County with nearby schools including Town Creek Elementary School, Esperanza Middle School, and Great Mills High School.
Ownership History
Date
Name
Owned For
Owner Type
Purchase Details
Closed on
Mar 2, 2010
Sold by
Tiger Paw Properties Llc
Bought by
Boswell Jason S and Presnell Kristin E
Current Estimated Value
Purchase Details
Closed on
Apr 17, 2009
Sold by
Secretary Of Veterans Affairs
Bought by
Tiger Paw Properties Llc
Purchase Details
Closed on
Nov 3, 2008
Sold by
Lovett Rodney Terrance
Bought by
Secretary Of Veterans Affairs
Purchase Details
Closed on
Oct 28, 2008
Sold by
Lovett Rodney Terrance
Bought by
Secretary Of Veterans Affairs
Purchase Details
Closed on
Nov 2, 2000
Sold by
Watson Norman G
Bought by
Lovett Rodney Terrance
Purchase Details
Closed on
Jun 6, 1997
Sold by
Secretary Of Veterans Affairs The
Bought by
Watson Norman G and Watson Francine O
Purchase Details
Closed on
Nov 21, 1996
Sold by
Portka Gary Joseph
Bought by
Secretary Of Veterans Affairs The
Create a Home Valuation Report for This Property
The Home Valuation Report is an in-depth analysis detailing your home's value as well as a comparison with similar homes in the area
Home Values in the Area
Average Home Value in this Area
Purchase History
| Date | Buyer | Sale Price | Title Company |
|---|---|---|---|
| Boswell Jason S | $148,000 | -- | |
| Tiger Paw Properties Llc | $72,500 | -- | |
| Secretary Of Veterans Affairs | $93,000 | -- | |
| Secretary Of Veterans Affairs | $93,000 | -- | |
| Lovett Rodney Terrance | $92,500 | -- | |
| Watson Norman G | $82,500 | -- | |
| Secretary Of Veterans Affairs The | $72,157 | -- |
Source: Public Records
Mortgage History
| Date | Status | Borrower | Loan Amount |
|---|---|---|---|
| Closed | Boswell Jason S | -- |
Source: Public Records
Tax History Compared to Growth
Tax History
| Year | Tax Paid | Tax Assessment Tax Assessment Total Assessment is a certain percentage of the fair market value that is determined by local assessors to be the total taxable value of land and additions on the property. | Land | Improvement |
|---|---|---|---|---|
| 2025 | $2,090 | $187,833 | $0 | $0 |
| 2024 | $1,776 | $158,367 | $0 | $0 |
| 2023 | $1,463 | $128,900 | $57,000 | $71,900 |
| 2022 | $1,403 | $123,467 | $0 | $0 |
| 2021 | $1,344 | $118,033 | $0 | $0 |
| 2020 | $1,285 | $112,600 | $45,000 | $67,600 |
| 2019 | $1,283 | $112,600 | $45,000 | $67,600 |
| 2018 | $1,281 | $112,600 | $45,000 | $67,600 |
| 2017 | $1,376 | $124,100 | $0 | $0 |
| 2016 | -- | $124,100 | $0 | $0 |
| 2015 | $1,760 | $124,100 | $0 | $0 |
| 2014 | $1,760 | $135,500 | $0 | $0 |
Source: Public Records
Map
Nearby Homes
- 22453 Macarthur Blvd
- 22436 Macarthur Blvd
- 22489 Wainwright Ct
- 45895 S Poteat Ct
- 45880 S Springsteen Ct
- 45867 Broun Terrace
- 22529 Chickadee Cir Unit 6-2
- 45869 Belvoir Rd
- 46124 Thoroughbred Way
- 46118 Seabiscuit Ct
- 0 Gold Finch Dr
- 22243 Scott Cir
- 45526 Woodcroft Way
- 45872 Saint Jeromes Ct
- 22033 Saint Gabriels Cir
- 45521 Westmeath Way Unit 12
- 45512 Westmeath Way Unit B13
- 45472 Westmeath Way Unit I12
- 45462 Westmeath Way Unit K-21
- 22615 Woods Ln
- 45864 N Poteat Ct
- 22421 Macarthur Blvd
- 45887 Nolte Ct
- 45883 Nolte Ct
- 45893 Nolte Ct
- 45860 N Poteat Ct
- 45867 N Poteat Ct
- 22413 Macarthur Blvd
- 45879 Nolte Ct
- 45861 N Poteat Ct
- 45884 S Poteat Ct
- 45856 N Poteat Ct
- 48566 Nolte Ct
- 45881 S Poteat Ct
- 22424 Macarthur Blvd
- 45857 N Poteat Ct
- 45871 Nolte Ct
- 22407 Macarthur Blvd
- 45884 Nolte Ct
- 45850 N Springsteen Ct