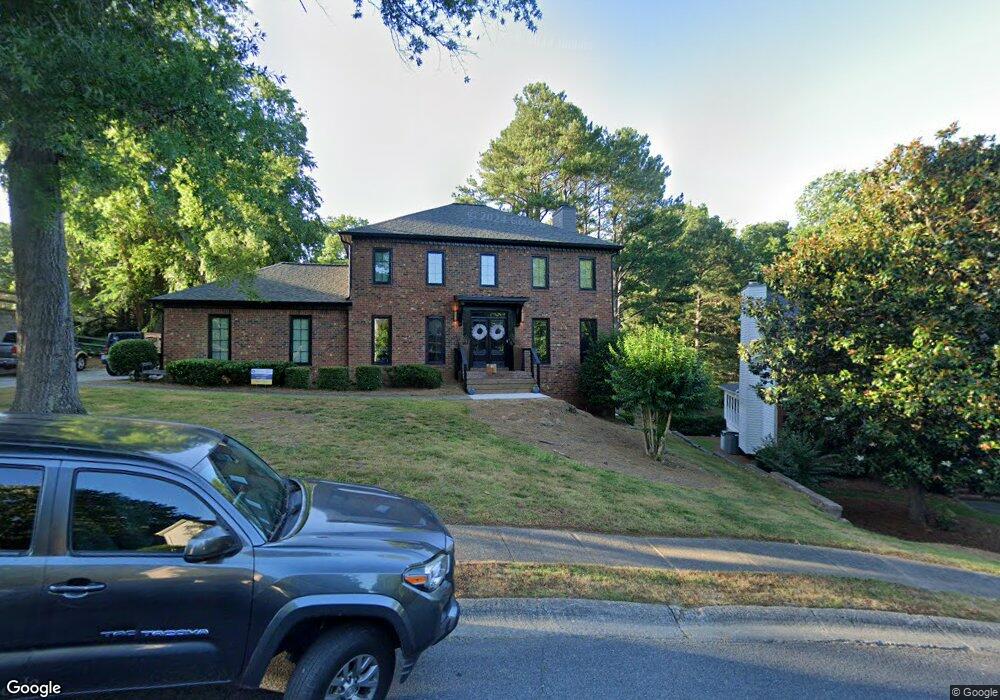
4588 Blakedale Cir NE Unit 1 Roswell, GA 30075
East Cobb NeighborhoodEstimated Value: $609,000 - $687,000
4
Beds
4
Baths
2,420
Sq Ft
$268/Sq Ft
Est. Value
About This Home
This home is located at 4588 Blakedale Cir NE Unit 1, Roswell, GA 30075 and is currently estimated at $649,001, approximately $268 per square foot. 4588 Blakedale Cir NE Unit 1 is a home located in Cobb County with nearby schools including Garrison Mill Elementary School, Mabry Middle School, and Lassiter High School.
Ownership History
Date
Name
Owned For
Owner Type
Purchase Details
Closed on
Mar 12, 2021
Sold by
Zielke Ronald John and Zielke Karan Kimbrough
Bought by
Zielke Ronald John and Zielke Karan Kimbrough
Current Estimated Value
Home Financials for this Owner
Home Financials are based on the most recent Mortgage that was taken out on this home.
Original Mortgage
$250,000
Outstanding Balance
$141,233
Interest Rate
2.9%
Mortgage Type
New Conventional
Estimated Equity
$507,768
Purchase Details
Closed on
Dec 20, 2001
Sold by
Berger Patricia and Berger Gordon M
Bought by
Zielke John and Zielke Karan K
Home Financials for this Owner
Home Financials are based on the most recent Mortgage that was taken out on this home.
Original Mortgage
$184,000
Interest Rate
6.13%
Mortgage Type
New Conventional
Purchase Details
Closed on
Jan 31, 1996
Sold by
King Robert H Susan
Bought by
Berger Patricia A Gordon
Create a Home Valuation Report for This Property
The Home Valuation Report is an in-depth analysis detailing your home's value as well as a comparison with similar homes in the area
Home Values in the Area
Average Home Value in this Area
Purchase History
| Date | Buyer | Sale Price | Title Company |
|---|---|---|---|
| Zielke Ronald John | -- | First American Mortgage Sln | |
| Zielke John | $230,000 | -- | |
| Berger Patricia A Gordon | $171,900 | -- |
Source: Public Records
Mortgage History
| Date | Status | Borrower | Loan Amount |
|---|---|---|---|
| Open | Zielke Ronald John | $250,000 | |
| Closed | Zielke John | $184,000 | |
| Closed | Berger Patricia A Gordon | $0 |
Source: Public Records
Tax History Compared to Growth
Tax History
| Year | Tax Paid | Tax Assessment Tax Assessment Total Assessment is a certain percentage of the fair market value that is determined by local assessors to be the total taxable value of land and additions on the property. | Land | Improvement |
|---|---|---|---|---|
| 2025 | $5,422 | $234,308 | $48,000 | $186,308 |
| 2024 | $5,427 | $234,308 | $48,000 | $186,308 |
| 2023 | $4,531 | $218,036 | $40,400 | $177,636 |
| 2022 | $4,176 | $175,096 | $34,000 | $141,096 |
| 2021 | $4,176 | $175,096 | $34,000 | $141,096 |
| 2020 | $3,952 | $164,864 | $34,000 | $130,864 |
| 2019 | $3,605 | $149,028 | $34,000 | $115,028 |
| 2018 | $3,605 | $149,028 | $34,000 | $115,028 |
| 2017 | $3,247 | $136,936 | $34,000 | $102,936 |
| 2016 | $3,255 | $136,936 | $34,000 | $102,936 |
| 2015 | $2,910 | $118,692 | $34,000 | $84,692 |
| 2014 | $2,928 | $118,692 | $0 | $0 |
Source: Public Records
Map
Nearby Homes
- 4274 Loch Highland Pkwy NE
- 4361 Old Mabry Ln NE
- 4209 Loch Highland Pkwy NE
- 4363 Old Mabry Rd NE
- 4019 Wesley Chapel Rd
- 3985 Loch Highland Pass NE
- 3870 Sweat Creek Run
- 4032 Wesley Chapel Rd
- 4022 Wesley Chapel Rd
- 4300 Inverness Ct NE Unit 1
- 3990 Wesley Chapel Rd
- 3778 Rivaridge Dr
- 3773 Rivaridge Dr
- 4579 Glenforest Dr NE
- 3935 Chapel Heights Dr
- 4765 Catoosa Trail NE Unit 2
- 3865 Mabry Rd NE
- 11395 West Rd
- 4590 Blakedale Cir NE
- 4586 Blakedale Cir NE
- 4587 Blakedale Cir NE Unit 1
- 4584 Blakedale Cir NE Unit 7
- 4593 Blakedale Cir NE Unit 7
- 4592 Blakedale Cir NE Unit 7
- 4581 Blakedale Cir NE
- 4582 Blakedale Cir NE Unit 7
- 4597 Blakedale Cir NE
- 4597 Blakedale Cir NE Unit 10
- 4594 Blakedale Cir NE
- 4596 Blakedale Cir NE Unit 7
- 4293 Rocky Glen NE
- 4295 Rocky Glen NE
- 4599 Blakedale Cir NE
- 4580 Blakedale Cir NE Unit 7
- 4297 Rocky Glen NE
- 4598 Blakedale Cir NE
- 4042 Chapel Grove Dr
- 4038 Chapel Grove Dr