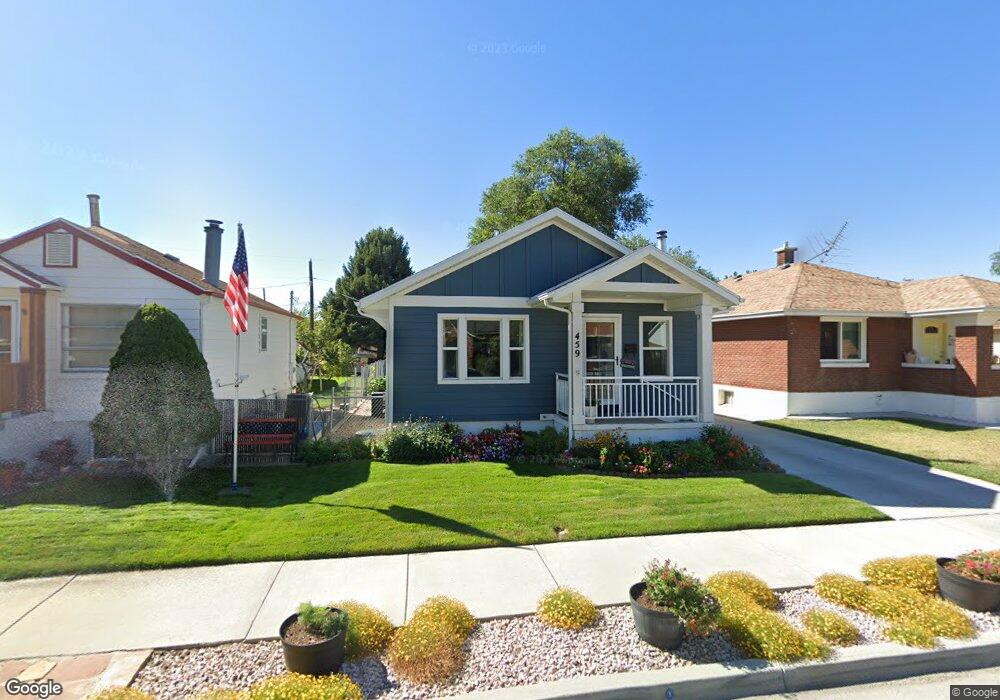
459 Cross St Ogden, UT 84404
Hillcrest-Bonneville NeighborhoodEstimated Value: $329,000 - $359,000
3
Beds
1
Bath
1,342
Sq Ft
$261/Sq Ft
Est. Value
About This Home
This home is located at 459 Cross St, Ogden, UT 84404 and is currently estimated at $350,689, approximately $261 per square foot. 459 Cross St is a home located in Weber County with nearby schools including Bonneville School, Highland Junior High School, and Ben Lomond High School.
Ownership History
Date
Name
Owned For
Owner Type
Purchase Details
Closed on
Nov 15, 2019
Sold by
Church Mark G and Church Amy M
Bought by
Church Mark Grant and The Mark Grant Church Trust
Current Estimated Value
Purchase Details
Closed on
Apr 9, 2004
Sold by
Church Amy M
Bought by
Church Mark G and Church Amy M
Home Financials for this Owner
Home Financials are based on the most recent Mortgage that was taken out on this home.
Original Mortgage
$55,600
Outstanding Balance
$25,634
Interest Rate
5.37%
Mortgage Type
Purchase Money Mortgage
Estimated Equity
$325,055
Purchase Details
Closed on
Feb 14, 1997
Sold by
Snell Eric D
Bought by
Hadley Christopher B and Hadley Heidi A
Home Financials for this Owner
Home Financials are based on the most recent Mortgage that was taken out on this home.
Original Mortgage
$56,700
Interest Rate
7.85%
Create a Home Valuation Report for This Property
The Home Valuation Report is an in-depth analysis detailing your home's value as well as a comparison with similar homes in the area
Home Values in the Area
Average Home Value in this Area
Purchase History
| Date | Buyer | Sale Price | Title Company |
|---|---|---|---|
| Church Mark Grant | -- | None Available | |
| Church Mark G | -- | Mountain View Title | |
| Church Amy M | -- | Mountain View Title | |
| Hadley Christopher B | -- | Bonneville Title |
Source: Public Records
Mortgage History
| Date | Status | Borrower | Loan Amount |
|---|---|---|---|
| Open | Church Amy M | $55,600 | |
| Previous Owner | Hadley Christopher B | $56,700 | |
| Closed | Church Amy M | $13,900 |
Source: Public Records
Tax History Compared to Growth
Tax History
| Year | Tax Paid | Tax Assessment Tax Assessment Total Assessment is a certain percentage of the fair market value that is determined by local assessors to be the total taxable value of land and additions on the property. | Land | Improvement |
|---|---|---|---|---|
| 2025 | $2,598 | $380,911 | $101,329 | $279,582 |
| 2024 | $2,445 | $193,597 | $55,730 | $137,867 |
| 2023 | $2,312 | $184,249 | $50,923 | $133,326 |
| 2022 | $2,589 | $206,800 | $42,818 | $163,982 |
| 2021 | $2,059 | $273,000 | $48,082 | $224,918 |
| 2020 | $1,731 | $211,999 | $38,311 | $173,688 |
| 2019 | $1,730 | $199,000 | $28,487 | $170,513 |
| 2018 | $1,269 | $145,001 | $24,524 | $120,477 |
| 2017 | $1,087 | $116,000 | $24,524 | $91,476 |
| 2016 | $919 | $53,040 | $11,389 | $41,651 |
| 2015 | $856 | $48,215 | $11,389 | $36,826 |
| 2014 | $872 | $48,215 | $9,990 | $38,225 |
Source: Public Records
Map
Nearby Homes
- 868 Washington Blvd
- 520 Chester St
- 740 Adams Ave
- 955 Kiesel Ave
- 965 Kiesel Ave
- 987 S Jefferson Ave
- 358 E 11th St
- 347 8th St
- 968 S Jefferson Ave
- 909 Grant Ave
- 1107 Jefferson Ave
- 322 E 750 S
- 544 7th St
- 250 9th St
- 590 7th St
- 225 8th St
- 232 7th St
- 3564 S Jefferson Ave
- 155 E 900 St S Unit 103
- 155 E 900 St S Unit 107