Estimated Value: $345,000 - $356,000
3
Beds
1
Bath
1,706
Sq Ft
$206/Sq Ft
Est. Value
About This Home
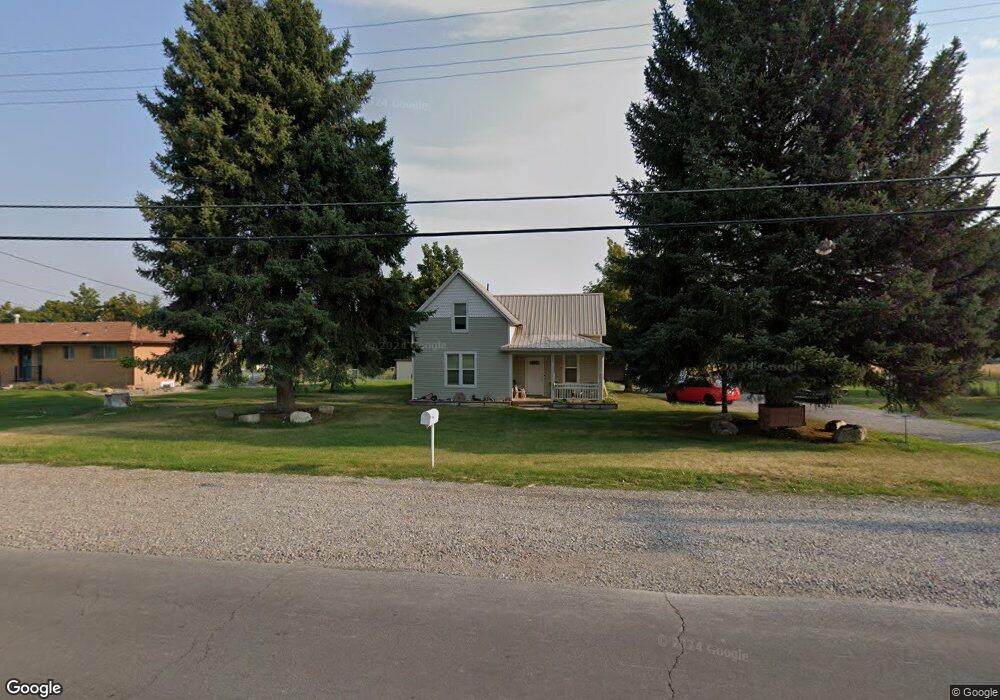
This home is located at 459 E 100 S, Hyrum, UT 84319 and is currently estimated at $350,950, approximately $205 per square foot. 459 E 100 S is a home located in Cache County with nearby schools including Lincoln School, South Cache Middle School, and Mountain Crest High School.
Ownership History
Date
Name
Owned For
Owner Type
Purchase Details
Closed on
May 7, 2013
Sold by
Pete & Trena Zaccardi Trust
Bought by
Zaccardi Trena B and The Faith Trust
Current Estimated Value
Purchase Details
Closed on
May 31, 2007
Sold by
Zaccardi Peter John and Zaccardi Trena B
Bought by
Zaccardi Peter John and Zaccardi Trena B
Home Financials for this Owner
Home Financials are based on the most recent Mortgage that was taken out on this home.
Original Mortgage
$100,000
Outstanding Balance
$60,363
Interest Rate
6.12%
Mortgage Type
New Conventional
Estimated Equity
$290,587
Purchase Details
Closed on
Oct 25, 2006
Sold by
Smith Troy J and Smith Kimett M
Bought by
Zaccardi Peter John and Zaccardi Trena B
Create a Home Valuation Report for This Property
The Home Valuation Report is an in-depth analysis detailing your home's value as well as a comparison with similar homes in the area
Home Values in the Area
Average Home Value in this Area
Purchase History
| Date | Buyer | Sale Price | Title Company |
|---|---|---|---|
| Zaccardi Trena B | -- | Founders Title Co Park City | |
| Zaccardi Peter John | -- | Atlas Title Insurance | |
| Zaccardi Pete John | -- | Atlas Title Insurance | |
| Zaccardi Peter John | -- | Hickman Land Title Company | |
| Smith Troy J | -- | Hickman Land Title Company |
Source: Public Records
Mortgage History
| Date | Status | Borrower | Loan Amount |
|---|---|---|---|
| Open | Zaccardi Pete John | $100,000 |
Source: Public Records
Tax History
| Year | Tax Paid | Tax Assessment Tax Assessment Total Assessment is a certain percentage of the fair market value that is determined by local assessors to be the total taxable value of land and additions on the property. | Land | Improvement |
|---|---|---|---|---|
| 2025 | $1,321 | $189,630 | $0 | $0 |
| 2024 | $142 | $190,105 | $0 | $0 |
| 2023 | $1,434 | $183,885 | $0 | $0 |
| 2022 | $1,150 | $141,270 | $0 | $0 |
| 2021 | $1,082 | $203,486 | $71,720 | $131,766 |
| 2020 | $984 | $173,448 | $71,720 | $101,728 |
| 2019 | $924 | $152,988 | $51,260 | $101,728 |
| 2018 | $889 | $142,260 | $51,260 | $91,000 |
| 2017 | $838 | $70,230 | $0 | $0 |
| 2016 | $857 | $70,230 | $0 | $0 |
| 2015 | $859 | $70,230 | $0 | $0 |
| 2014 | $838 | $70,065 | $0 | $0 |
| 2013 | -- | $70,065 | $0 | $0 |
Source: Public Records
Map
Nearby Homes
Your Personal Tour Guide
Ask me questions while you tour the home.