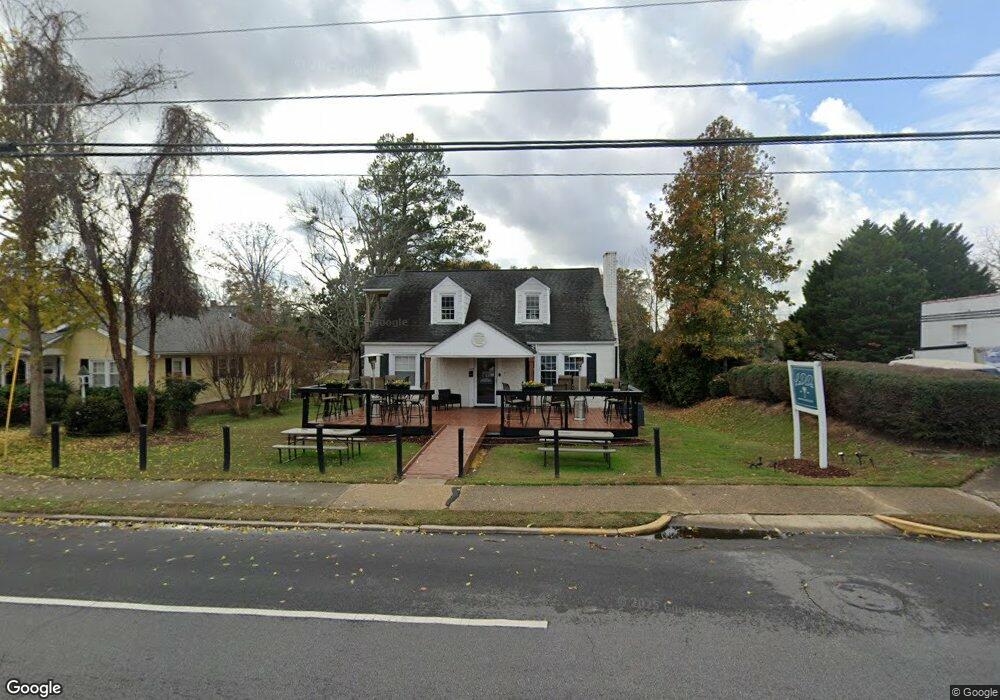
459 E Main St Clayton, NC 27520
Estimated Value: $329,000 - $373,000
2
Beds
2
Baths
1,913
Sq Ft
$179/Sq Ft
Est. Value
About This Home
This home is located at 459 E Main St, Clayton, NC 27520 and is currently estimated at $343,218, approximately $179 per square foot. 459 E Main St is a home located in Johnston County with nearby schools including Cooper Academy, Riverwood Middle School, and Clayton High.
Ownership History
Date
Name
Owned For
Owner Type
Purchase Details
Closed on
Apr 1, 2011
Sold by
Ks Bank Inc
Bought by
Godwin Shauna R
Current Estimated Value
Home Financials for this Owner
Home Financials are based on the most recent Mortgage that was taken out on this home.
Original Mortgage
$104,500
Outstanding Balance
$72,197
Interest Rate
4.83%
Mortgage Type
Future Advance Clause Open End Mortgage
Estimated Equity
$271,021
Purchase Details
Closed on
Oct 12, 2007
Sold by
Bunn Shirley H and Bunn Don
Bought by
Gidco Inc
Home Financials for this Owner
Home Financials are based on the most recent Mortgage that was taken out on this home.
Original Mortgage
$184,900
Interest Rate
6.26%
Mortgage Type
Purchase Money Mortgage
Purchase Details
Closed on
Apr 5, 2005
Sold by
Hogg Johnny L and Hogg Linda C
Bought by
Hogg Rupert Ted
Purchase Details
Closed on
Mar 30, 2005
Sold by
Hogg Rupert Ted
Bought by
Hogg Johnny L and Hogg Linda C
Create a Home Valuation Report for This Property
The Home Valuation Report is an in-depth analysis detailing your home's value as well as a comparison with similar homes in the area
Home Values in the Area
Average Home Value in this Area
Purchase History
| Date | Buyer | Sale Price | Title Company |
|---|---|---|---|
| Godwin Shauna R | $110,000 | None Available | |
| Gidco Inc | $160,000 | None Available | |
| Hogg Rupert Ted | $20,000 | None Available | |
| Hogg Johnny L | $20,000 | None Available |
Source: Public Records
Mortgage History
| Date | Status | Borrower | Loan Amount |
|---|---|---|---|
| Open | Godwin Shauna R | $104,500 | |
| Previous Owner | Gidco Inc | $184,900 |
Source: Public Records
Tax History
| Year | Tax Paid | Tax Assessment Tax Assessment Total Assessment is a certain percentage of the fair market value that is determined by local assessors to be the total taxable value of land and additions on the property. | Land | Improvement |
|---|---|---|---|---|
| 2025 | $2,400 | $329,520 | $169,600 | $159,920 |
| 2024 | $2,503 | $189,640 | $84,800 | $104,840 |
| 2023 | $2,446 | $189,640 | $84,800 | $104,840 |
| 2022 | $2,522 | $0 | $0 | $0 |
| 2021 | $2,484 | $189,640 | $84,800 | $104,840 |
| 2020 | $2,541 | $189,640 | $84,800 | $104,840 |
| 2019 | $2,541 | $189,640 | $84,800 | $104,840 |
| 2018 | $2,231 | $164,050 | $84,800 | $79,250 |
| 2017 | $2,182 | $164,050 | $84,800 | $79,250 |
| 2016 | $3,605 | $161,410 | $84,800 | $76,610 |
| 2015 | $2,596 | $156,160 | $84,800 | $71,360 |
| 2014 | $2,559 | $156,160 | $84,800 | $71,360 |
Source: Public Records
Map
Nearby Homes
- 109 Hardee St
- 130 Cooper St
- 330 E Stallings St
- 216 Crescent Dr
- 0 Washington and Smith St
- 320 Crescent Dr
- 328 S Lombard St
- 177 Buckhorn Branch Park
- 253 Buckhorn Branch Park
- 90 Buckhorn Branch Park
- 420 E Hinton St
- 400 E Hinton St
- 0 E Hinton St Unit 10142176
- 418 S Lombard St
- 420 Cooper St
- 0 Washington St Unit 10147077
- 221 Palomino Way
- 423 Barbour St
- 886 John St
- 60 Seville Way
Your Personal Tour Guide
Ask me questions while you tour the home.