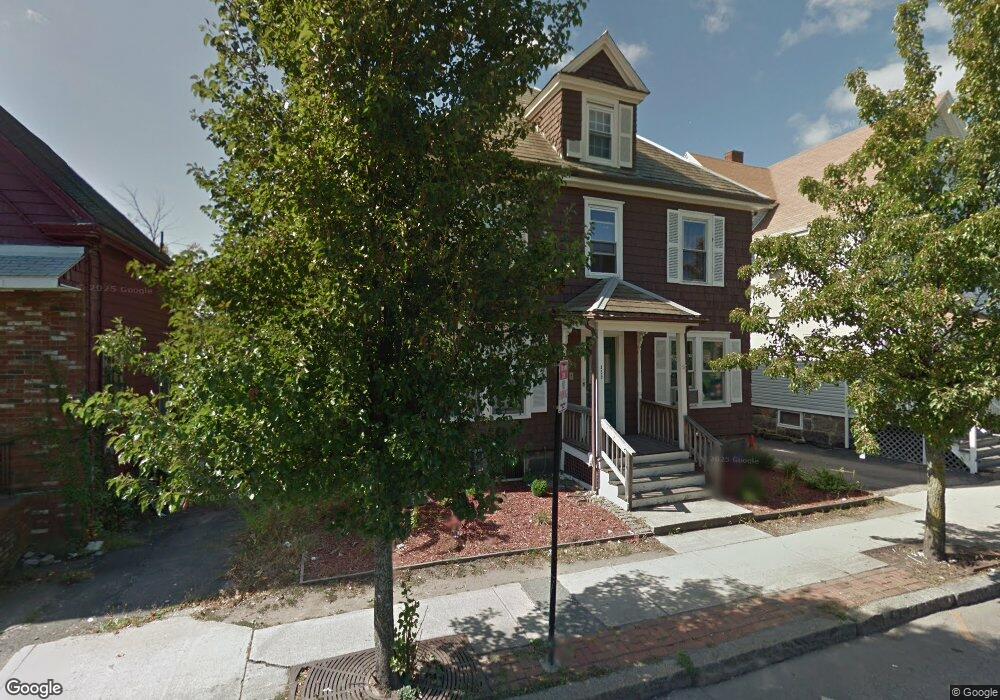
459 Hancock St Quincy, MA 02171
Montclair NeighborhoodEstimated Value: $911,845 - $1,240,000
6
Beds
4
Baths
2,614
Sq Ft
$405/Sq Ft
Est. Value
About This Home
This home is located at 459 Hancock St, Quincy, MA 02171 and is currently estimated at $1,057,461, approximately $404 per square foot. 459 Hancock St is a home located in Norfolk County with nearby schools including Montclair Elementary School, Atlantic Middle School, and North Quincy High School.
Ownership History
Date
Name
Owned For
Owner Type
Purchase Details
Closed on
Oct 20, 2025
Sold by
Bnw Realty Llc
Bought by
463 Hancock Llc
Current Estimated Value
Purchase Details
Closed on
Apr 20, 2010
Sold by
Digone Llc
Bought by
Bnw Realty Llc
Purchase Details
Closed on
Mar 16, 2010
Sold by
Hsbc Bank Usa
Bought by
Digone Llc
Purchase Details
Closed on
May 4, 2009
Sold by
Coffinet Eleanor M and Hsbc Bank Usa
Bought by
Hsbc Bank Usa
Purchase Details
Closed on
Jun 29, 2006
Sold by
New 459 Hancock Rt and Walsh
Bought by
Coffinet Eleanor M
Home Financials for this Owner
Home Financials are based on the most recent Mortgage that was taken out on this home.
Original Mortgage
$421,600
Interest Rate
6.58%
Mortgage Type
Commercial
Create a Home Valuation Report for This Property
The Home Valuation Report is an in-depth analysis detailing your home's value as well as a comparison with similar homes in the area
Home Values in the Area
Average Home Value in this Area
Purchase History
| Date | Buyer | Sale Price | Title Company |
|---|---|---|---|
| 463 Hancock Llc | $1,187,500 | -- | |
| Bnw Realty Llc | $400,000 | -- | |
| Bnw Realty Llc | $400,000 | -- | |
| Digone Llc | $304,800 | -- | |
| Digone Llc | $304,800 | -- | |
| Hsbc Bank Usa | $475,035 | -- | |
| Hsbc Bank Usa | $475,035 | -- | |
| Coffinet Eleanor M | $527,000 | -- | |
| Coffinet Eleanor M | $527,000 | -- |
Source: Public Records
Mortgage History
| Date | Status | Borrower | Loan Amount |
|---|---|---|---|
| Previous Owner | Coffinet Eleanor M | $421,600 | |
| Previous Owner | Coffinet Eleanor M | $288,000 |
Source: Public Records
Tax History Compared to Growth
Tax History
| Year | Tax Paid | Tax Assessment Tax Assessment Total Assessment is a certain percentage of the fair market value that is determined by local assessors to be the total taxable value of land and additions on the property. | Land | Improvement |
|---|---|---|---|---|
| 2025 | $9,541 | $827,500 | $305,100 | $522,400 |
| 2024 | $9,027 | $801,000 | $288,200 | $512,800 |
| 2023 | $8,527 | $766,100 | $262,000 | $504,100 |
| 2022 | $8,400 | $701,200 | $209,600 | $491,600 |
| 2021 | $8,379 | $690,200 | $209,600 | $480,600 |
| 2020 | $7,986 | $642,500 | $193,400 | $449,100 |
| 2019 | $7,930 | $631,900 | $186,000 | $445,900 |
| 2018 | $7,029 | $526,900 | $188,200 | $338,700 |
| 2017 | $5,943 | $419,400 | $171,100 | $248,300 |
| 2016 | $5,631 | $392,100 | $162,800 | $229,300 |
| 2015 | $5,418 | $371,100 | $153,000 | $218,100 |
| 2014 | $5,372 | $361,500 | $149,700 | $211,800 |
Source: Public Records
Map
Nearby Homes
- 522 Hancock St
- 143 Arlington St
- 17 Holmes St Unit 2
- 17 Holmes St Unit 4
- 11 Earle St
- 250 Fayette St
- 101 Beach St
- 115 W Squantum St Unit 907
- 115 W Squantum St Unit 810
- 85 E Squantum St Unit 10
- 6 Warwick St
- 58 Bayfield Rd S
- 45 Marion St
- 140 Phillips St
- 38 Walker St
- 100 Grandview Ave Unit 11A
- 129-131 Pine St
- 111 Warren Ave Unit 1F
- 201 Billings St
- 169 Pine St
- 455 Hancock St Unit 1
- 455 Hancock St
- 463 Hancock St
- 468 Hancock St
- 470 Hancock St
- 470 Hancock St Unit 1
- 470 Hancock St Unit 1 470
- 120 Holmes St Unit 321
- 120 Holmes St Unit 320
- 120 Holmes St Unit 319
- 120 Holmes St Unit 318
- 120 Holmes St Unit 317
- 120 Holmes St Unit 316
- 120 Holmes St Unit 315
- 120 Holmes St Unit 314
- 120 Holmes St Unit 313
- 120 Holmes St Unit 312
- 120 Holmes St Unit 311
- 120 Holmes St Unit 310
- 120 Holmes St Unit 308