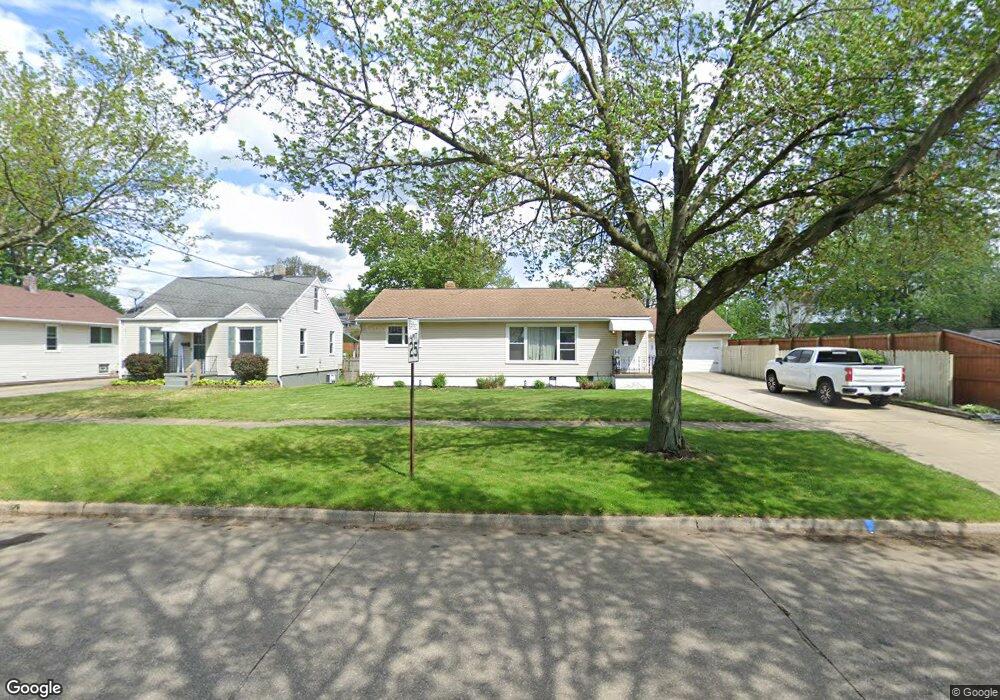
459 High Grove Blvd Akron, OH 44312
Ellet NeighborhoodEstimated Value: $132,666 - $161,000
3
Beds
1
Bath
1,056
Sq Ft
$141/Sq Ft
Est. Value
About This Home
This home is located at 459 High Grove Blvd, Akron, OH 44312 and is currently estimated at $148,417, approximately $140 per square foot. 459 High Grove Blvd is a home located in Summit County with nearby schools including Ellet High School, Summit Academy Akron Elementary School, and Hatton Community Learning Center.
Ownership History
Date
Name
Owned For
Owner Type
Purchase Details
Closed on
Jan 21, 2010
Sold by
Sill Crystal L and Doyle Crystal L
Bought by
Doyle Crystal L
Current Estimated Value
Home Financials for this Owner
Home Financials are based on the most recent Mortgage that was taken out on this home.
Original Mortgage
$123,514
Outstanding Balance
$80,267
Interest Rate
4.75%
Mortgage Type
FHA
Estimated Equity
$68,150
Purchase Details
Closed on
Mar 3, 2005
Sold by
Sill Dusty W
Bought by
Sill Crystal L
Purchase Details
Closed on
May 28, 2003
Sold by
Giffin Oscar D and Giffin John W
Bought by
Sill Dusty W and Sill Crystal L
Home Financials for this Owner
Home Financials are based on the most recent Mortgage that was taken out on this home.
Original Mortgage
$96,678
Interest Rate
5.9%
Mortgage Type
FHA
Purchase Details
Closed on
Dec 27, 2002
Sold by
Estate Of Pauline Forest Giffin
Bought by
Giffin Oscar D
Create a Home Valuation Report for This Property
The Home Valuation Report is an in-depth analysis detailing your home's value as well as a comparison with similar homes in the area
Home Values in the Area
Average Home Value in this Area
Purchase History
| Date | Buyer | Sale Price | Title Company |
|---|---|---|---|
| Doyle Crystal L | -- | Sherman Title Agency Inc | |
| Sill Crystal L | -- | -- | |
| Sill Dusty W | $98,200 | Multiple | |
| Giffin Oscar D | -- | -- |
Source: Public Records
Mortgage History
| Date | Status | Borrower | Loan Amount |
|---|---|---|---|
| Open | Doyle Crystal L | $123,514 | |
| Closed | Sill Dusty W | $96,678 |
Source: Public Records
Tax History Compared to Growth
Tax History
| Year | Tax Paid | Tax Assessment Tax Assessment Total Assessment is a certain percentage of the fair market value that is determined by local assessors to be the total taxable value of land and additions on the property. | Land | Improvement |
|---|---|---|---|---|
| 2025 | $1,969 | $37,016 | $7,693 | $29,323 |
| 2024 | $1,969 | $37,016 | $7,693 | $29,323 |
| 2023 | $1,969 | $37,016 | $7,693 | $29,323 |
| 2022 | $1,808 | $26,629 | $5,534 | $21,095 |
| 2021 | $1,809 | $26,629 | $5,534 | $21,095 |
| 2020 | $1,782 | $26,630 | $5,530 | $21,100 |
| 2019 | $1,721 | $23,310 | $6,060 | $17,250 |
| 2018 | $1,698 | $23,310 | $6,060 | $17,250 |
| 2017 | $1,725 | $23,310 | $6,060 | $17,250 |
| 2016 | $1,726 | $23,310 | $6,060 | $17,250 |
| 2015 | $1,725 | $23,310 | $6,060 | $17,250 |
| 2014 | $1,711 | $23,310 | $6,060 | $17,250 |
| 2013 | $1,912 | $26,750 | $6,060 | $20,690 |
Source: Public Records
Map
Nearby Homes
- 490 Stevenson Ave
- 544 Dennison Ave
- 412 Stevenson Ave
- 379 Stull Ave
- 440 Wirth Ave
- 307 Pauline Ave
- 2948 Trenton Rd
- 423 Stetler Ave
- 256 High Grove Blvd
- 0 Kreiner Ave
- 2487 Delaware Ave
- 2528 Ogden Ave
- 905 1/2 Shadybrook Dr
- 117 Kreiner Ave
- 2863 Burnside St
- 6 Kreiner Ave
- 5 Kreiner Ave
- 2835 Farmdale Rd
- 805 Utica Ave
- 1200 Abington Rd
- 457 High Grove Blvd
- 453 High Grove Blvd
- 464 Alpha Ave
- 449 High Grove Blvd
- 2789 Albrecht Ave
- 466 Alpha Ave
- 458 Alpha Ave
- 452 Alpha Ave
- 452 Alpha Ave
- 2795 Albrecht Ave
- 445 High Grove Blvd
- 464 High Grove Blvd
- 454 High Grove Blvd
- 480 484 Alpha Ave
- 480 Alpha Ave Unit 484
- 482 Alpha Ave
- 435 High Grove Blvd
- 450 High Grove Blvd
- 463 Alpha Ave
- 446 High Grove Blvd