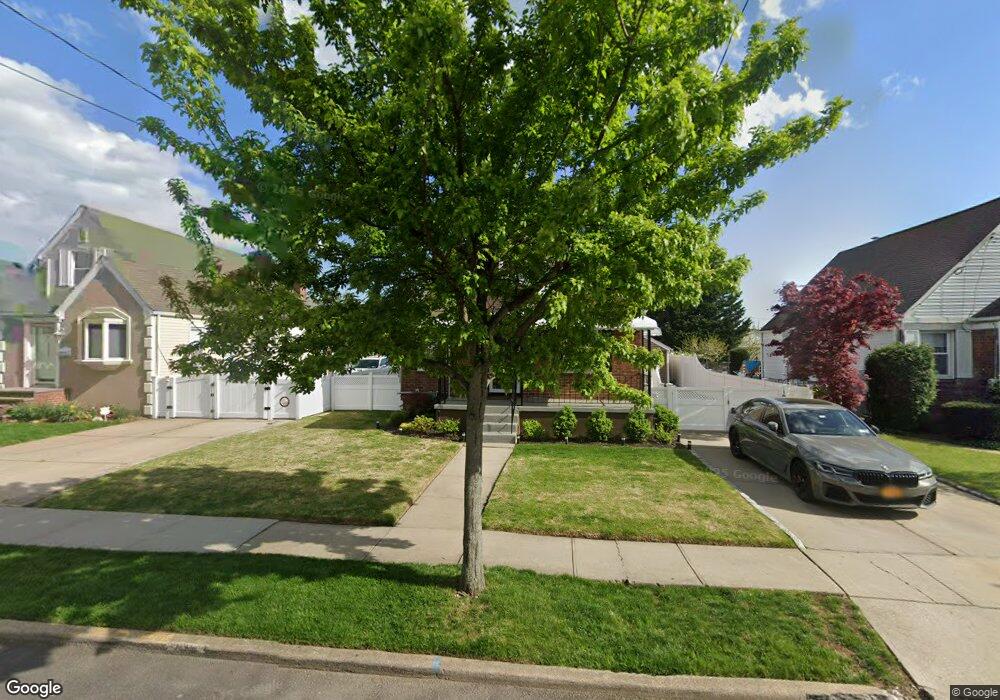
459 Jackson Ave Mineola, NY 11501
Estimated Value: $690,258 - $840,000
--
Bed
2
Baths
1,262
Sq Ft
$606/Sq Ft
Est. Value
About This Home
This home is located at 459 Jackson Ave, Mineola, NY 11501 and is currently estimated at $765,129, approximately $606 per square foot. 459 Jackson Ave is a home located in Nassau County with nearby schools including Mineola Middle School, Jackson Avenue School, and Mineola High School.
Ownership History
Date
Name
Owned For
Owner Type
Purchase Details
Closed on
Feb 17, 2006
Sold by
Shah Rajeshkumar
Current Estimated Value
Purchase Details
Closed on
Mar 9, 2004
Sold by
Doshi Milan
Bought by
Shah Rajeshkumar
Purchase Details
Closed on
Sep 14, 2000
Sold by
Rivers Stephen and Rivers Catherine
Bought by
Doshi Milan and Doshi Manisha
Purchase Details
Closed on
Aug 28, 1995
Sold by
Marino Michael and Marino Charlotte
Bought by
Rivers Stephen and Rivers Catherine
Home Financials for this Owner
Home Financials are based on the most recent Mortgage that was taken out on this home.
Original Mortgage
$153,000
Interest Rate
7.81%
Purchase Details
Closed on
May 5, 1995
Sold by
Grieco Anthony Est
Bought by
Grieco Anthony Est
Create a Home Valuation Report for This Property
The Home Valuation Report is an in-depth analysis detailing your home's value as well as a comparison with similar homes in the area
Home Values in the Area
Average Home Value in this Area
Purchase History
| Date | Buyer | Sale Price | Title Company |
|---|---|---|---|
| -- | $520,000 | -- | |
| -- | $520,000 | -- | |
| Shah Rajeshkumar | $455,000 | -- | |
| Shah Rajeshkumar | $455,000 | -- | |
| Doshi Milan | $265,000 | Mansukhlal Koya | |
| Doshi Milan | $265,000 | Mansukhlal Koya | |
| Rivers Stephen | $170,000 | -- | |
| Rivers Stephen | $170,000 | -- | |
| Grieco Anthony Est | -- | -- | |
| Grieco Anthony Est | -- | -- |
Source: Public Records
Mortgage History
| Date | Status | Borrower | Loan Amount |
|---|---|---|---|
| Previous Owner | Rivers Stephen | $153,000 |
Source: Public Records
Tax History Compared to Growth
Tax History
| Year | Tax Paid | Tax Assessment Tax Assessment Total Assessment is a certain percentage of the fair market value that is determined by local assessors to be the total taxable value of land and additions on the property. | Land | Improvement |
|---|---|---|---|---|
| 2025 | $10,692 | $572 | $273 | $299 |
| 2024 | $2,388 | $572 | $273 | $299 |
| 2023 | $10,646 | $572 | $273 | $299 |
| 2022 | $10,646 | $572 | $273 | $299 |
| 2021 | $10,856 | $570 | $272 | $298 |
| 2020 | $11,475 | $929 | $675 | $254 |
| 2019 | $10,240 | $929 | $675 | $254 |
| 2018 | $9,684 | $929 | $0 | $0 |
| 2017 | $6,414 | $929 | $675 | $254 |
| 2016 | $8,634 | $929 | $675 | $254 |
| 2015 | $2,061 | $929 | $675 | $254 |
| 2014 | $2,061 | $929 | $675 | $254 |
| 2013 | $1,989 | $929 | $675 | $254 |
Source: Public Records
Map
Nearby Homes
- 466 Jefferson Place
- 239 White Rd
- 136 Wardwell Rd
- 372 Jackson Ave
- 244 Andrews Rd
- 62 12th Ave
- 96 Millington Place
- 360 Foch Blvd
- 229 Brixton Rd
- 134 Marcellus Rd
- 126 2nd St
- 225 Brixton Rd
- 338 Bauer Place
- 209 Brompton Rd
- 424 Andrews Rd
- 437 Andrews Rd
- 311 Horton Hwy
- 236 Jackson Ave
- 452 Latham Rd
- 120 Horton Hwy Unit A-12
- 463 Jackson Ave
- 460 Lincoln Place
- 451 Jackson Ave
- 464 Lincoln Place
- 456 Lincoln Place
- 452 Lincoln Place
- 460 Jackson Ave
- 464 Jackson Ave
- 456 Jackson Ave
- 452 Jackson Ave
- 443 Jackson Ave
- 233 Wardwell Rd
- 195 Wardwell Rd
- 439 Jackson Ave
- 446 Jackson Ave
- 461 Jefferson Place
- 465 Jefferson Place
- 461 Lincoln Place
- 202 Wardwell Rd
- 469 Jefferson Place