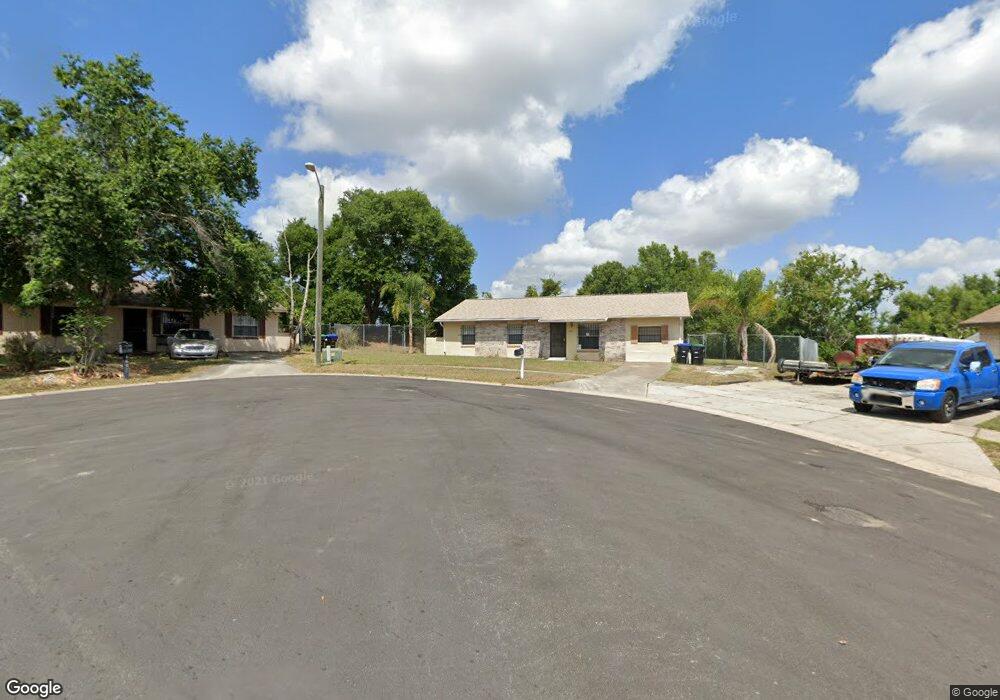
459 Lake Opal Ct Apopka, FL 32703
Estimated Value: $289,000 - $341,504
3
Beds
2
Baths
2,016
Sq Ft
$155/Sq Ft
Est. Value
About This Home
This home is located at 459 Lake Opal Ct, Apopka, FL 32703 and is currently estimated at $312,126, approximately $154 per square foot. 459 Lake Opal Ct is a home located in Orange County with nearby schools including Wheatley Elementary School, Wolf Lake Middle School, and Apopka High School.
Ownership History
Date
Name
Owned For
Owner Type
Purchase Details
Closed on
Aug 10, 2021
Sold by
Smith Alfreda M
Bought by
Maughn Anselm U
Current Estimated Value
Home Financials for this Owner
Home Financials are based on the most recent Mortgage that was taken out on this home.
Original Mortgage
$229,761
Outstanding Balance
$208,609
Interest Rate
2.8%
Mortgage Type
FHA
Estimated Equity
$103,517
Purchase Details
Closed on
Mar 9, 2010
Sold by
Aurora Loan Services Llc
Bought by
Smith Alfreda M
Purchase Details
Closed on
Aug 11, 2005
Sold by
Dls Consultants Inc
Bought by
Smith David and Smith Cheryl
Home Financials for this Owner
Home Financials are based on the most recent Mortgage that was taken out on this home.
Original Mortgage
$124,000
Interest Rate
6.25%
Mortgage Type
Purchase Money Mortgage
Purchase Details
Closed on
Mar 5, 2001
Sold by
Florida Cmnty Central I
Bought by
Dls Consultants Inc
Create a Home Valuation Report for This Property
The Home Valuation Report is an in-depth analysis detailing your home's value as well as a comparison with similar homes in the area
Home Values in the Area
Average Home Value in this Area
Purchase History
| Date | Buyer | Sale Price | Title Company |
|---|---|---|---|
| Maughn Anselm U | $234,000 | Brokers Ttl Of Longwood I Ll | |
| Smith Alfreda M | $37,500 | North American Title Comp | |
| Smith David | $64,500 | Exceptional Title Iii Llc | |
| Dls Consultants Inc | $86,000 | -- |
Source: Public Records
Mortgage History
| Date | Status | Borrower | Loan Amount |
|---|---|---|---|
| Open | Maughn Anselm U | $229,761 | |
| Previous Owner | Smith David | $124,000 |
Source: Public Records
Tax History
| Year | Tax Paid | Tax Assessment Tax Assessment Total Assessment is a certain percentage of the fair market value that is determined by local assessors to be the total taxable value of land and additions on the property. | Land | Improvement |
|---|---|---|---|---|
| 2025 | $4,278 | $281,727 | -- | -- |
| 2024 | $3,794 | $271,920 | $70,000 | $201,920 |
| 2023 | $3,794 | $258,321 | $70,000 | $188,321 |
| 2022 | $3,836 | $223,044 | $70,000 | $153,044 |
| 2021 | $2,728 | $174,339 | $40,000 | $134,339 |
| 2020 | $2,540 | $175,584 | $40,000 | $135,584 |
| 2019 | $2,456 | $158,853 | $30,000 | $128,853 |
| 2018 | $2,087 | $116,897 | $15,000 | $101,897 |
| 2017 | $1,924 | $105,170 | $15,000 | $90,170 |
| 2016 | $1,690 | $82,451 | $10,000 | $72,451 |
| 2015 | $1,587 | $73,875 | $6,000 | $67,875 |
| 2014 | $1,551 | $68,933 | $6,000 | $62,933 |
Source: Public Records
Map
Nearby Homes
- 433 Apopka Hills Cir
- 734 Creeping Fig St
- 710 Creeping Fig St
- 842 Creeping Fig St
- 854 Creeping Fig St
- 1221 Ocoee Apopka Rd
- 873 Pointe Emerson Blvd
- 900 Pointe Emerson Blvd
- 699 Pointe Emerson Blvd
- 374 Lady Palm St
- 240 W 13th St
- 398 Lady Palm St
- 406 Lady Palm St
- 414 Lady Palm St
- 1608 Long Ln
- 418 Lady Palm St
- 434 Lady Palm St
- 454 Lady Palm St
- 466 Lady Palm St
- 470 Lady Palm St
- 451 Lake Opal Ct
- 460 Lake Opal Ct
- 458 W 17th St
- 450 W 17th St
- 452 Lake Opal Ct
- 443 Lake Opal Ct
- 442 W 17th St
- 465 W 17th St
- 444 Lake Opal Ct
- 435 Lake Opal Ct
- 1496 Lake Opal Dr
- 434 W 17th St
- 436 Lake Opal Ct
- 457 W 17th St
- 449 W 17th St
- 1484 Lake Opal Dr
- 441 W 17th St
- 452 W Ella J Gilmore St
- 433 W 17th St
- 1429 Lake Opal Dr
Your Personal Tour Guide
Ask me questions while you tour the home.