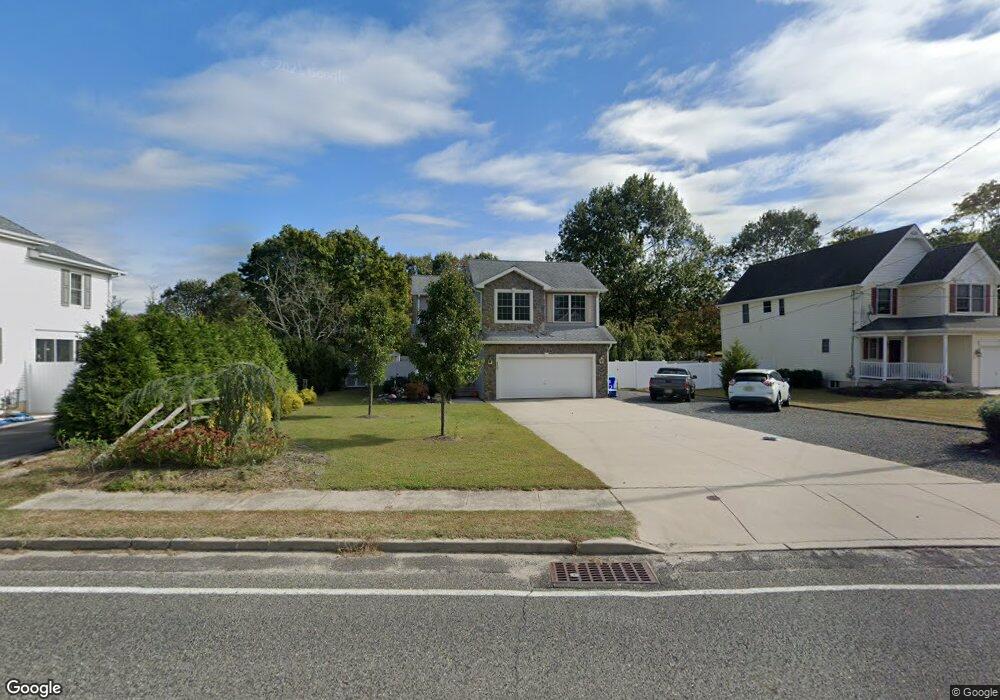
459 N Chew Rd Hammonton, NJ 08037
Estimated Value: $471,000 - $648,000
--
Bed
--
Bath
2,302
Sq Ft
$236/Sq Ft
Est. Value
About This Home
This home is located at 459 N Chew Rd, Hammonton, NJ 08037 and is currently estimated at $542,204, approximately $235 per square foot. 459 N Chew Rd is a home located in Atlantic County with nearby schools including Hammonton Early Childhood Education Center, Warren E. Sooy Jr. Elementary School, and Hammonton Middle School.
Ownership History
Date
Name
Owned For
Owner Type
Purchase Details
Closed on
Feb 15, 2007
Sold by
Joseph Porretta Builders Inc
Bought by
Panepinto John and Panepinto Cynthia
Current Estimated Value
Purchase Details
Closed on
Aug 24, 2004
Sold by
Oliver Matthew J and Corrado Michael
Bought by
Joseph Porretta Builders Inc
Home Financials for this Owner
Home Financials are based on the most recent Mortgage that was taken out on this home.
Original Mortgage
$30,400
Interest Rate
6.01%
Mortgage Type
Purchase Money Mortgage
Purchase Details
Closed on
Mar 31, 1989
Sold by
Olive Carmella
Bought by
Olive Matthew J and Olive Bombara,Marie
Purchase Details
Closed on
Jan 27, 1989
Sold by
Olive Millie
Bought by
Olive Matthew J and Olive Bombara,Marie
Create a Home Valuation Report for This Property
The Home Valuation Report is an in-depth analysis detailing your home's value as well as a comparison with similar homes in the area
Home Values in the Area
Average Home Value in this Area
Purchase History
| Date | Buyer | Sale Price | Title Company |
|---|---|---|---|
| Panepinto John | $293,500 | -- | |
| Joseph Porretta Builders Inc | $38,000 | The Title Company Of Jersey | |
| Olive Matthew J | -- | -- | |
| Olive Matthew J | -- | -- |
Source: Public Records
Mortgage History
| Date | Status | Borrower | Loan Amount |
|---|---|---|---|
| Previous Owner | Joseph Porretta Builders Inc | $30,400 |
Source: Public Records
Tax History Compared to Growth
Tax History
| Year | Tax Paid | Tax Assessment Tax Assessment Total Assessment is a certain percentage of the fair market value that is determined by local assessors to be the total taxable value of land and additions on the property. | Land | Improvement |
|---|---|---|---|---|
| 2025 | $8,592 | $312,200 | $51,500 | $260,700 |
| 2024 | $8,592 | $312,200 | $51,500 | $260,700 |
| 2023 | $8,501 | $312,200 | $51,500 | $260,700 |
| 2022 | $8,501 | $312,200 | $51,500 | $260,700 |
| 2021 | $8,532 | $312,200 | $51,500 | $260,700 |
| 2020 | $8,489 | $312,200 | $51,500 | $260,700 |
| 2019 | $8,458 | $312,200 | $51,500 | $260,700 |
| 2018 | $8,417 | $312,200 | $51,500 | $260,700 |
| 2017 | $8,298 | $312,200 | $51,500 | $260,700 |
| 2016 | $7,995 | $312,200 | $51,500 | $260,700 |
| 2015 | $7,761 | $312,200 | $51,500 | $260,700 |
| 2014 | $7,603 | $205,000 | $28,100 | $176,900 |
Source: Public Records
Map
Nearby Homes
- 539 Rail Way
- 312 W Pleasant St
- 312 Pleasant St W
- Chase Plan at West End
- 814 N Chew Rd
- 121 W End Ave
- 119 W End Ave
- 117 W End Ave
- 115 W End Ave
- 113 W End Ave
- 109 W End Ave
- 107 W End Ave
- 105 W End Ave
- 103 W End Ave
- 320 12th St
- 426 Bella Vita Ct
- 413 Pratt St
- 425 N Packard St
- 250 Rocco Dr
- 52 N Packard St