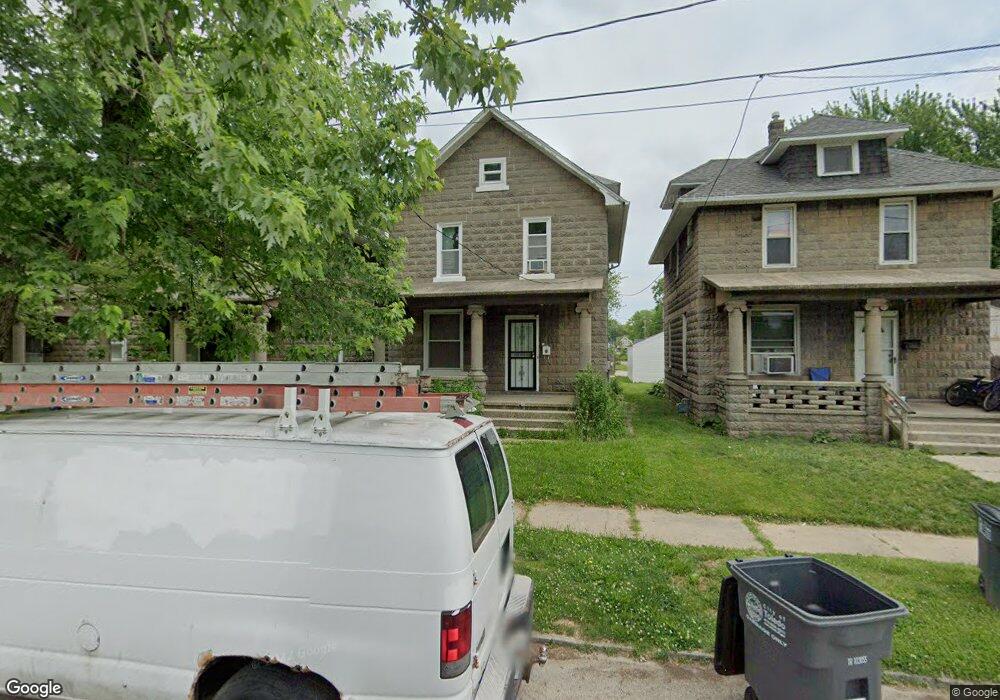
459 Spring Grove Ave Toledo, OH 43605
East Toledo NeighborhoodEstimated Value: $58,000 - $65,000
3
Beds
1
Bath
1,232
Sq Ft
$49/Sq Ft
Est. Value
About This Home
This home is located at 459 Spring Grove Ave, Toledo, OH 43605 and is currently estimated at $60,872, approximately $49 per square foot. 459 Spring Grove Ave is a home located in Lucas County with nearby schools including Raymer Elementary School, Waite High School, and Toledo Preparatory Academy.
Ownership History
Date
Name
Owned For
Owner Type
Purchase Details
Closed on
Oct 7, 2019
Sold by
Okonski Martin J and Okonski Melody D
Bought by
Okonski Mark J
Current Estimated Value
Home Financials for this Owner
Home Financials are based on the most recent Mortgage that was taken out on this home.
Original Mortgage
$28,000
Outstanding Balance
$24,479
Interest Rate
3.4%
Mortgage Type
New Conventional
Estimated Equity
$36,393
Purchase Details
Closed on
Mar 16, 1999
Sold by
Murray James J and Murray Paula J
Bought by
Okonski Martin J and Okonski Melody D
Home Financials for this Owner
Home Financials are based on the most recent Mortgage that was taken out on this home.
Original Mortgage
$28,000
Interest Rate
6.85%
Purchase Details
Closed on
Sep 19, 1990
Sold by
Pinkava Jerry S and Pinkava Mildred
Create a Home Valuation Report for This Property
The Home Valuation Report is an in-depth analysis detailing your home's value as well as a comparison with similar homes in the area
Home Values in the Area
Average Home Value in this Area
Purchase History
| Date | Buyer | Sale Price | Title Company |
|---|---|---|---|
| Okonski Mark J | $35,000 | Chicago Title | |
| Okonski Martin J | $40,000 | Northwest Title Agency Of Oh | |
| -- | $29,000 | -- |
Source: Public Records
Mortgage History
| Date | Status | Borrower | Loan Amount |
|---|---|---|---|
| Open | Okonski Mark J | $28,000 | |
| Previous Owner | Okonski Martin J | $28,000 |
Source: Public Records
Tax History Compared to Growth
Tax History
| Year | Tax Paid | Tax Assessment Tax Assessment Total Assessment is a certain percentage of the fair market value that is determined by local assessors to be the total taxable value of land and additions on the property. | Land | Improvement |
|---|---|---|---|---|
| 2024 | $460 | $12,565 | $3,325 | $9,240 |
| 2023 | $904 | $12,565 | $3,675 | $8,890 |
| 2022 | $902 | $12,565 | $3,675 | $8,890 |
| 2021 | $893 | $12,565 | $3,675 | $8,890 |
| 2020 | $877 | $10,605 | $3,080 | $7,525 |
| 2019 | $848 | $10,605 | $3,080 | $7,525 |
| 2018 | $839 | $10,605 | $3,080 | $7,525 |
| 2017 | $884 | $10,360 | $3,010 | $7,350 |
| 2016 | $864 | $29,600 | $8,600 | $21,000 |
| 2015 | $832 | $29,600 | $8,600 | $21,000 |
| 2014 | $652 | $10,360 | $3,010 | $7,350 |
| 2013 | $652 | $10,360 | $3,010 | $7,350 |
Source: Public Records
Map
Nearby Homes
- 520 Spring Grove Ave
- 463 Howland Ave
- 1912 Greenwood Ave
- 444 Raymer Blvd
- 566 Howland Ave
- 527 White St
- 616 Spring Grove Ave
- 1943 Starr Ave
- 558 Thurston St
- 1705 Idaho St
- 1525 Kelsey Ave
- 1215 Greenwood Ave
- 655 Raymer Blvd
- 1940 Hurd St
- 1326 Kelsey Ave
- 1931 Idaho St
- 1129 Mason St
- 715 Raymer Blvd
- 1207 Nevada St
- 343 Heffner St
- 457 Spring Grove Ave
- 457 Spring Grove Ave Unit 1
- 463 Spring Grove Ave
- 453 Spring Grove Ave
- 1712 Mason St
- 451 Spring Grove Ave
- 1703 Greenwood Ave
- 1707 Greenwood Ave
- 1714 Mason St
- 1701 Greenwood Ave
- 1709 Greenwood Ave
- 1713 Greenwood Ave
- 1716 Mason St
- 1715 Greenwood Ave
- 1719 Greenwood Ave
- 1722 Mason St
- 1717 Mason St
- 1725 Greenwood Ave
- 1725 Greenwood Ave
- 417 Spring Grove Ave