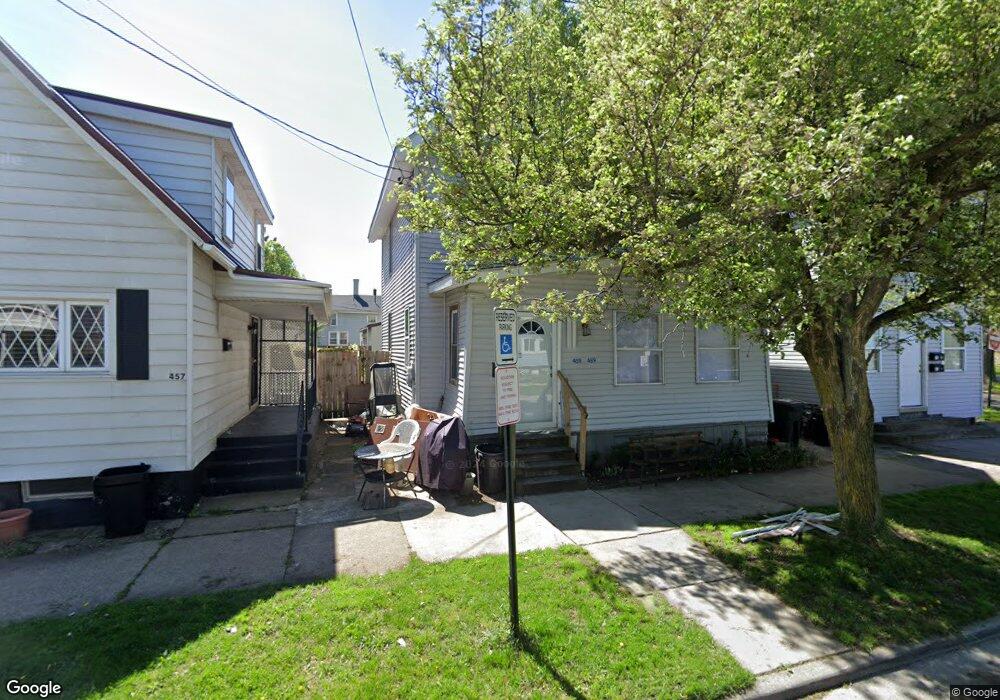
459 W 2nd St Erie, PA 16507
West Bayfront NeighborhoodEstimated Value: $54,000 - $117,000
3
Beds
1
Bath
1,200
Sq Ft
$67/Sq Ft
Est. Value
About This Home
This home is located at 459 W 2nd St, Erie, PA 16507 and is currently estimated at $80,590, approximately $67 per square foot. 459 W 2nd St is a home located in Erie County with nearby schools including Pfeiffer-Burleigh Elementary School, East Middle School, and Erie High School.
Ownership History
Date
Name
Owned For
Owner Type
Purchase Details
Closed on
Mar 5, 2024
Sold by
Hill Eddie E
Bought by
Hill Eddie E and Hubbart Lisa
Current Estimated Value
Purchase Details
Closed on
Sep 29, 2023
Sold by
Cubias Esteban H and Cubias Maria L
Bought by
Hill Eddie E
Home Financials for this Owner
Home Financials are based on the most recent Mortgage that was taken out on this home.
Original Mortgage
$33,950
Interest Rate
7.09%
Mortgage Type
New Conventional
Purchase Details
Closed on
May 6, 2008
Sold by
Cowger Larry E
Bought by
Cubias Esteban H and Cubias Maria L
Home Financials for this Owner
Home Financials are based on the most recent Mortgage that was taken out on this home.
Original Mortgage
$9,000
Interest Rate
5.93%
Mortgage Type
Seller Take Back
Purchase Details
Closed on
Jun 20, 2000
Sold by
Harrington Susan E and Harrington Bradley W
Bought by
Cowger Larry E
Create a Home Valuation Report for This Property
The Home Valuation Report is an in-depth analysis detailing your home's value as well as a comparison with similar homes in the area
Home Values in the Area
Average Home Value in this Area
Purchase History
| Date | Buyer | Sale Price | Title Company |
|---|---|---|---|
| Hill Eddie E | -- | None Listed On Document | |
| Hill Eddie E | $35,000 | None Listed On Document | |
| Cubias Esteban H | $9,000 | None Available | |
| Cowger Larry E | $11,000 | -- |
Source: Public Records
Mortgage History
| Date | Status | Borrower | Loan Amount |
|---|---|---|---|
| Previous Owner | Hill Eddie E | $33,950 | |
| Previous Owner | Cubias Esteban H | $9,000 |
Source: Public Records
Tax History Compared to Growth
Tax History
| Year | Tax Paid | Tax Assessment Tax Assessment Total Assessment is a certain percentage of the fair market value that is determined by local assessors to be the total taxable value of land and additions on the property. | Land | Improvement |
|---|---|---|---|---|
| 2025 | $1,447 | $36,600 | $6,400 | $30,200 |
| 2024 | $1,416 | $36,600 | $6,400 | $30,200 |
| 2023 | $1,376 | $36,600 | $6,400 | $30,200 |
| 2022 | $1,347 | $36,600 | $6,400 | $30,200 |
| 2021 | $1,328 | $36,600 | $6,400 | $30,200 |
| 2020 | $1,319 | $36,600 | $6,400 | $30,200 |
| 2019 | $1,250 | $36,600 | $6,400 | $30,200 |
| 2018 | $1,235 | $36,600 | $6,400 | $30,200 |
| 2017 | $1,233 | $36,600 | $6,400 | $30,200 |
| 2016 | $1,384 | $36,600 | $6,400 | $30,200 |
| 2015 | $1,375 | $36,600 | $6,400 | $30,200 |
| 2014 | $1,186 | $36,600 | $6,400 | $30,200 |
Source: Public Records
Map
Nearby Homes