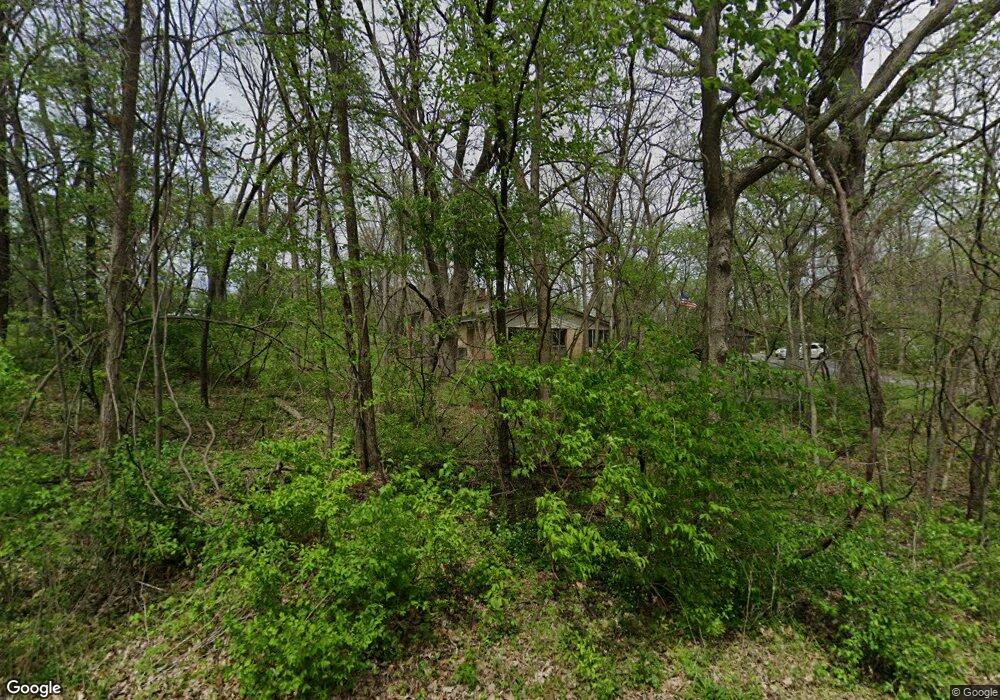
459 Willow Rd New Lenox, IL 60451
Estimated Value: $421,000 - $516,000
--
Bed
--
Bath
--
Sq Ft
1.28
Acres
About This Home
This home is located at 459 Willow Rd, New Lenox, IL 60451 and is currently estimated at $450,874. 459 Willow Rd is a home located in Will County with nearby schools including Oster-Oakview School, Haines Elementary School, and Lincoln Way West.
Ownership History
Date
Name
Owned For
Owner Type
Purchase Details
Closed on
Nov 10, 2014
Sold by
Hosman Jerry E and Hosman Linda
Bought by
First Bank Of Manhattan and Trust #629
Current Estimated Value
Purchase Details
Closed on
Mar 27, 2014
Sold by
First Bank Of Manhattan
Bought by
Hosman Jerry E and Hosman Linda
Purchase Details
Closed on
Mar 20, 2008
Sold by
Hosman Jerry E and Hosman Linda
Bought by
First Bank Of Manhattan and Trust #629
Purchase Details
Closed on
May 16, 2006
Sold by
Hosman Jerry E and Hosman Linda J
Bought by
Hosman Jerry E and Hosman Linda J
Purchase Details
Closed on
Jun 19, 2002
Sold by
Dandrea Diana M and Hosman Diana M
Bought by
Hosman Jerry E
Purchase Details
Closed on
Oct 14, 1998
Sold by
Hosman Jerry E and Hosman Diana
Bought by
Hosman Jeerry E and Hosman Diana
Purchase Details
Closed on
Sep 15, 1995
Sold by
Hosman Kathleen R
Bought by
Hosman Jerry E
Create a Home Valuation Report for This Property
The Home Valuation Report is an in-depth analysis detailing your home's value as well as a comparison with similar homes in the area
Home Values in the Area
Average Home Value in this Area
Purchase History
| Date | Buyer | Sale Price | Title Company |
|---|---|---|---|
| First Bank Of Manhattan | -- | None Available | |
| Hosman Jerry E | -- | None Available | |
| First Bank Of Manhattan | -- | None Available | |
| Hosman Jerry E | -- | None Available | |
| Hosman Jerry E | -- | -- | |
| Hosman Jeerry E | -- | -- | |
| Hosman Jerry E | -- | -- |
Source: Public Records
Tax History Compared to Growth
Tax History
| Year | Tax Paid | Tax Assessment Tax Assessment Total Assessment is a certain percentage of the fair market value that is determined by local assessors to be the total taxable value of land and additions on the property. | Land | Improvement |
|---|---|---|---|---|
| 2024 | $9,219 | $133,827 | $30,769 | $103,058 |
| 2023 | $9,219 | $121,993 | $28,048 | $93,945 |
| 2022 | $7,036 | $112,384 | $25,839 | $86,545 |
| 2021 | $7,129 | $105,694 | $24,301 | $81,393 |
| 2020 | $7,196 | $101,923 | $23,434 | $78,489 |
| 2019 | $7,117 | $98,762 | $22,707 | $76,055 |
| 2018 | $7,215 | $95,357 | $21,924 | $73,433 |
| 2017 | $6,835 | $92,616 | $21,294 | $71,322 |
| 2016 | $6,622 | $90,137 | $20,724 | $69,413 |
| 2015 | $6,391 | $87,300 | $20,072 | $67,228 |
| 2014 | $6,391 | $86,222 | $19,824 | $66,398 |
| 2013 | $6,391 | $87,384 | $20,091 | $67,293 |
Source: Public Records
Map
Nearby Homes
- Vacant W Maple St
- 338 Willow St
- 1500 Ramp
- 331 Old Hickory Rd
- 1301 Silver Cross Blvd
- 218 Manor Dr Unit A
- 416 Manor Ct Unit B
- 125 Kimber Dr
- 1701 Grand Prairie Dr
- 154 Barbara Ln
- 574 Prairie Crossing Dr
- 133 Barbara Ln
- 217 Aspen Dr
- 203 Fir St
- 1344 N Cedar Rd
- 0 Silver Cross Blvd
- 1999 Silver Cross Blvd
- 315 S Pine St
- 224 Hauser Ct
- 200 Redwood Ave
- 455 Willow Rd
- 460 Willow Rd
- 506 Willow Rd
- 1122 Banbury Dr
- 1122 Banbury Ln
- 454 Willow Rd
- 517 Willow Rd
- 458 Sycamore St
- 460 Sycamore St
- 538 Willow Rd
- 1144 Banbury Dr
- 450 Willow Rd
- 1121 Banbury Dr
- 540 Willow Rd
- 1111 Banbury Dr
- 524 Thornhouse Crescent
- 1154 Banbury Dr
- 0 Bjork Dr
- 470 Sycamore St
- 530 Thornhouse Crescent