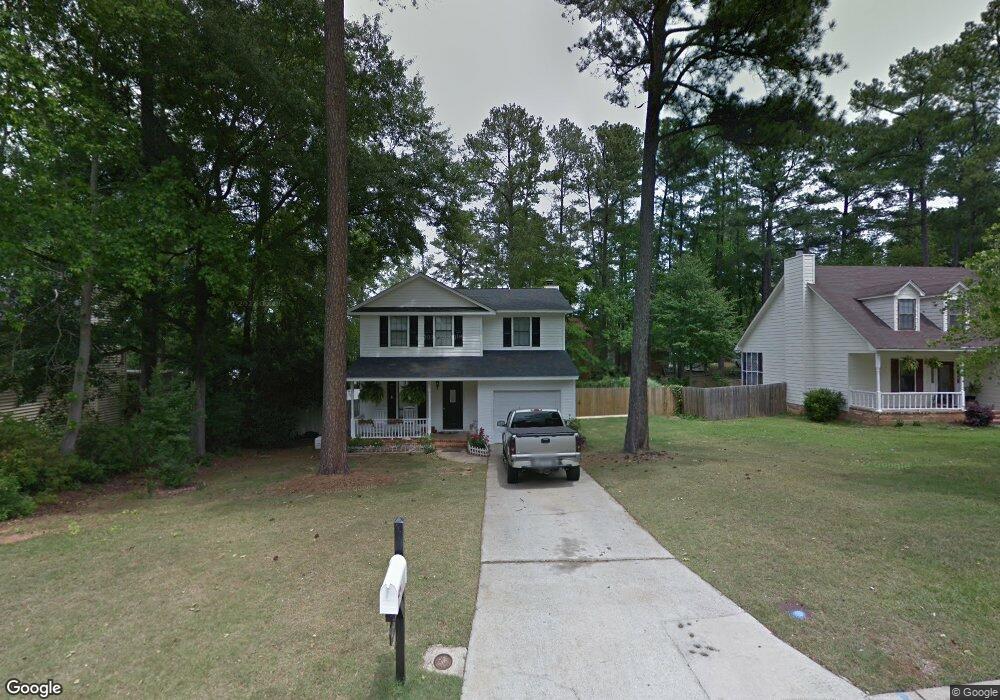
459 Windtree Place Augusta, GA 30907
Estimated Value: $248,000 - $270,000
3
Beds
3
Baths
1,674
Sq Ft
$156/Sq Ft
Est. Value
About This Home
This home is located at 459 Windtree Place, Augusta, GA 30907 and is currently estimated at $261,406, approximately $156 per square foot. 459 Windtree Place is a home located in Columbia County with nearby schools including Martinez Elementary School, Lakeside Middle School, and Lakeside High School.
Ownership History
Date
Name
Owned For
Owner Type
Purchase Details
Closed on
Jan 17, 2007
Sold by
Budwick Peter
Bought by
Tovar Victor M
Current Estimated Value
Home Financials for this Owner
Home Financials are based on the most recent Mortgage that was taken out on this home.
Original Mortgage
$129,900
Outstanding Balance
$77,022
Interest Rate
6.07%
Mortgage Type
New Conventional
Estimated Equity
$184,384
Purchase Details
Closed on
Jan 16, 2007
Sold by
Williams Stephen J
Bought by
Budwick Peter
Home Financials for this Owner
Home Financials are based on the most recent Mortgage that was taken out on this home.
Original Mortgage
$129,900
Outstanding Balance
$77,022
Interest Rate
6.07%
Mortgage Type
New Conventional
Estimated Equity
$184,384
Purchase Details
Closed on
Aug 17, 2001
Sold by
Williams Sandra O
Bought by
Williams Stephen J
Create a Home Valuation Report for This Property
The Home Valuation Report is an in-depth analysis detailing your home's value as well as a comparison with similar homes in the area
Home Values in the Area
Average Home Value in this Area
Purchase History
| Date | Buyer | Sale Price | Title Company |
|---|---|---|---|
| Tovar Victor M | $137,900 | -- | |
| Budwick Peter | $132,000 | -- | |
| Williams Stephen J | -- | -- |
Source: Public Records
Mortgage History
| Date | Status | Borrower | Loan Amount |
|---|---|---|---|
| Open | Tovar Victor M | $129,900 |
Source: Public Records
Tax History
| Year | Tax Paid | Tax Assessment Tax Assessment Total Assessment is a certain percentage of the fair market value that is determined by local assessors to be the total taxable value of land and additions on the property. | Land | Improvement |
|---|---|---|---|---|
| 2025 | $2,366 | $96,754 | $19,604 | $77,150 |
| 2024 | $2,073 | $80,623 | $19,504 | $61,119 |
| 2023 | $2,073 | $77,645 | $19,504 | $58,141 |
| 2022 | $1,614 | $59,845 | $12,804 | $47,041 |
| 2021 | $1,905 | $67,902 | $12,604 | $55,298 |
| 2020 | $1,842 | $64,242 | $12,604 | $51,638 |
| 2019 | $1,627 | $56,459 | $11,104 | $45,355 |
| 2018 | $1,623 | $56,157 | $11,104 | $45,053 |
| 2017 | $1,591 | $54,785 | $10,404 | $44,381 |
| 2016 | $1,470 | $52,332 | $9,480 | $42,852 |
| 2015 | $1,505 | $53,530 | $9,480 | $44,050 |
| 2014 | $1,475 | $51,795 | $9,480 | $42,315 |
Source: Public Records
Map
Nearby Homes
- 452 Windtree Place
- 340 Lamplighter Ln
- 0 Mccormick Rd Unit 547611
- 344 Marshall St
- 427 Bristol Rd
- 5553 Connor Dr
- 386 Connor Cir
- 417 Blue Ridge Dr
- 4108 Mansfield Place
- 4176 Arlington Rd
- 455 Bristol Rd
- 375 Connor Cir
- 4106 Mansfield Place
- 233 Anneswood Rd
- 3744 Cactus Trail
- 503 Adams Mill Ln
- 3779 Winchester Trail
- 241 Old Evans Rd
- 4080 Harden Ct
- 4039 Delray Ct
- 457 Windtree Place
- 461 Windtree Place
- 457 Windtree Place
- 4086 Old Petersburg Rd
- 4088 Old Petersburg Rd
- 463 Windtree Place
- 453 Windtree Place
- 401 Windtree Ct
- 451 Windtree Place
- 4084 Old Petersburg Rd
- 4084 River Watch Pkwy
- 402 Windtree Ct
- 464 Windtree Place
- 465 Windtree Place
- 403 Windtree Ct
- 456 Windtree Place
- 466 Windtree Place
- 4067 Old Petersburg Rd
- 4069 Old Petersburg Rd
- 4082 Old Petersburg Rd
Your Personal Tour Guide
Ask me questions while you tour the home.