4592 Tidal Cove Ct Las Vegas, NV 89147
Rancho Viejo NeighborhoodEstimated Value: $569,022 - $651,000
4
Beds
2
Baths
2,312
Sq Ft
$257/Sq Ft
Est. Value
About This Home
This home is located at 4592 Tidal Cove Ct, Las Vegas, NV 89147 and is currently estimated at $593,756, approximately $256 per square foot. 4592 Tidal Cove Ct is a home located in Clark County with nearby schools including Frank Kim Elementary School, Clifford J Lawrence Junior High School, and Spring Valley High School.
Ownership History
Date
Name
Owned For
Owner Type
Purchase Details
Closed on
Jul 20, 2011
Sold by
D R Horton Inc
Bought by
Dieu Victor and Ng Lai Ho
Current Estimated Value
Home Financials for this Owner
Home Financials are based on the most recent Mortgage that was taken out on this home.
Original Mortgage
$178,856
Outstanding Balance
$122,699
Interest Rate
4.45%
Mortgage Type
New Conventional
Estimated Equity
$471,057
Purchase Details
Closed on
Jun 24, 2011
Sold by
Guo Renmin
Bought by
Ng Lai
Home Financials for this Owner
Home Financials are based on the most recent Mortgage that was taken out on this home.
Original Mortgage
$178,856
Outstanding Balance
$122,699
Interest Rate
4.45%
Mortgage Type
New Conventional
Estimated Equity
$471,057
Purchase Details
Closed on
Jun 16, 2011
Sold by
Lee Mei Ho
Bought by
Dieu Victor
Home Financials for this Owner
Home Financials are based on the most recent Mortgage that was taken out on this home.
Original Mortgage
$178,856
Outstanding Balance
$122,699
Interest Rate
4.45%
Mortgage Type
New Conventional
Estimated Equity
$471,057
Create a Home Valuation Report for This Property
The Home Valuation Report is an in-depth analysis detailing your home's value as well as a comparison with similar homes in the area
Home Values in the Area
Average Home Value in this Area
Purchase History
| Date | Buyer | Sale Price | Title Company |
|---|---|---|---|
| Dieu Victor | $223,570 | Dhi Title Of Nevada | |
| Ng Lai | -- | Dhi Title Of Nevada | |
| Dieu Victor | -- | Dhi Title Of Nevada |
Source: Public Records
Mortgage History
| Date | Status | Borrower | Loan Amount |
|---|---|---|---|
| Open | Dieu Victor | $178,856 |
Source: Public Records
Tax History Compared to Growth
Tax History
| Year | Tax Paid | Tax Assessment Tax Assessment Total Assessment is a certain percentage of the fair market value that is determined by local assessors to be the total taxable value of land and additions on the property. | Land | Improvement |
|---|---|---|---|---|
| 2025 | $3,054 | $154,457 | $46,200 | $108,257 |
| 2024 | $2,966 | $154,457 | $46,200 | $108,257 |
| 2023 | $2,966 | $144,967 | $43,750 | $101,217 |
| 2022 | $2,879 | $129,252 | $37,100 | $92,152 |
| 2021 | $2,796 | $119,921 | $32,550 | $87,371 |
| 2020 | $2,711 | $117,129 | $30,800 | $86,329 |
| 2019 | $2,632 | $113,119 | $29,750 | $83,369 |
| 2018 | $2,556 | $103,612 | $24,150 | $79,462 |
| 2017 | $3,062 | $104,412 | $24,150 | $80,262 |
| 2016 | $2,420 | $98,024 | $20,650 | $77,374 |
| 2015 | $2,415 | $84,672 | $16,450 | $68,222 |
| 2014 | $2,345 | $80,611 | $11,200 | $69,411 |
Source: Public Records
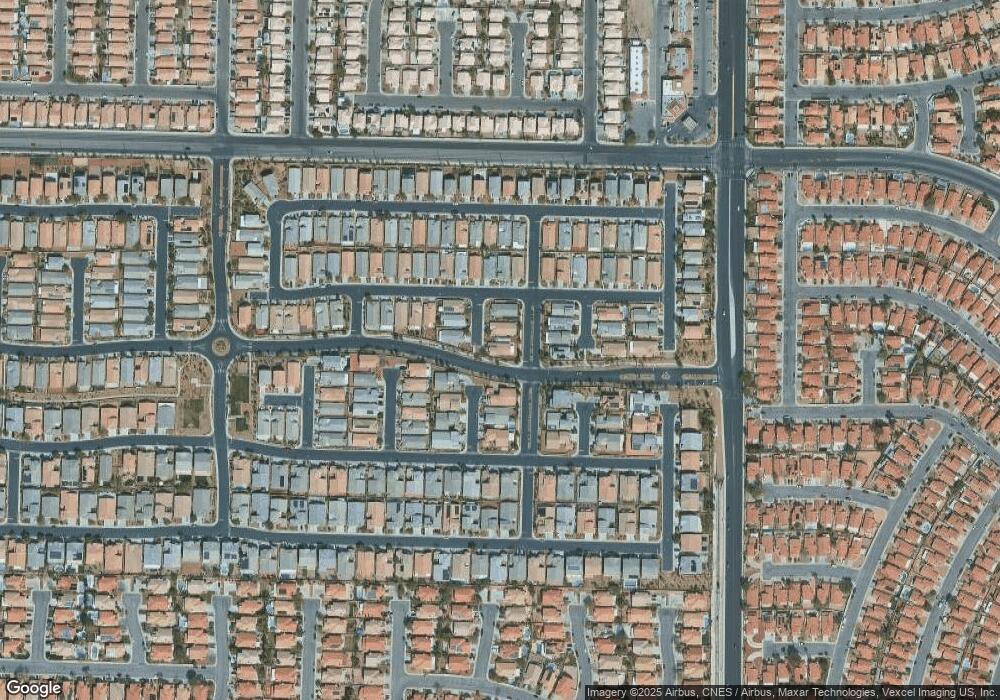
Map
Nearby Homes
- 7869 Barntucket Ave
- 4595 Grindle Point St
- 7822 Whitlocks Mill Ave
- 7932 Barntucket Ave
- 4484 Warbonnet Way
- 7777 Barbican Ct
- 4580 Allenford Dr
- 4567 Avery Rock St
- 7924 Bridgefield Ln
- 7936 Canto Ave
- 4721 Jasper Rock Ct
- 8083 Shadowvale Dr
- 4725 Cosley Dr
- 7729 Rathburn Ave
- 7971 Lisa Dawn Ave
- 4404 Elk Point Cir Unit 6
- 4557 Rockland Break Ct
- 4658 Cosley Dr
- 8137 Cape Flattery Ave
- 8065 Cimarron Meadows Way
- 4586 Tidal Cove Ct
- 4580 Tidal Cove Ct
- 4618 Longnook Ct
- 4591 Tidal Cove Ct
- 4585 Tidal Cove Ct
- 4605 Longnook Ct
- 4589 Pigeon Point Ct
- 4579 Tidal Cove Ct
- 4595 Pigeon Point Ct
- 4595 Pigeon Point Ct Unit n/a
- 4583 Pigeon Point Ct
- 4630 Longnook Ct
- 4619 Longnook Ct
- 4577 Pigeon Point Ct
- 7911 Whitlocks Mill Ave
- 4615 White Head Ct
- 7870 Whitlocks Mill Ave
- 7876 Whitlocks Mill Ave
- 7868 Whitlocks Mill Ave
- 7882 Whitlocks Mill Ave