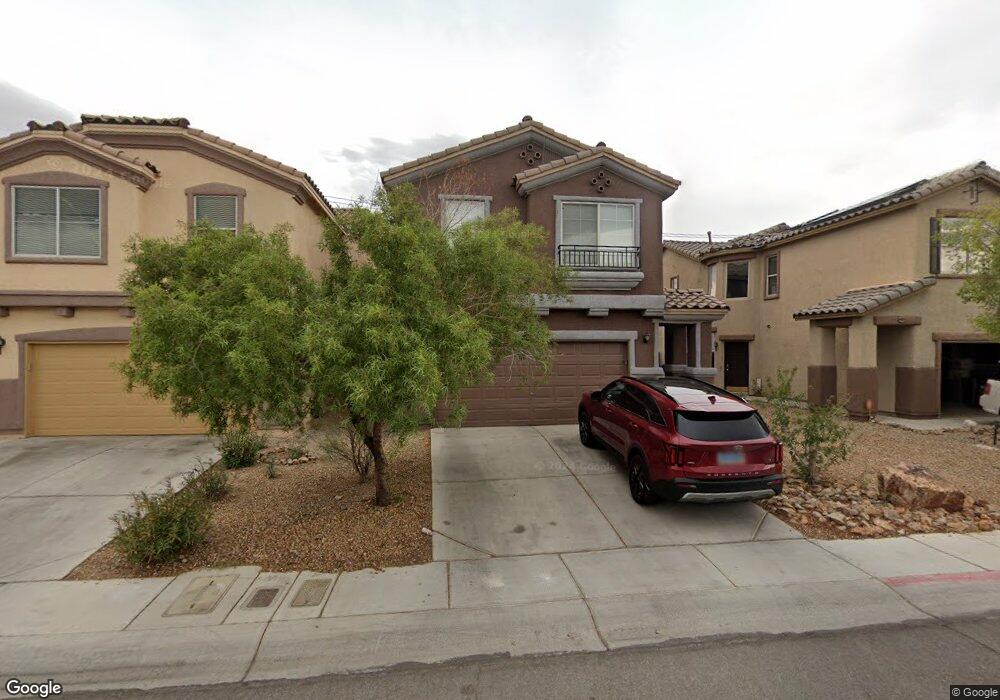
4593 Chanted Heart Ave Unit None Las Vegas, NV 89115
Estimated Value: $392,136
4
Beds
3
Baths
1,949
Sq Ft
$201/Sq Ft
Est. Value
About This Home
This home is located at 4593 Chanted Heart Ave Unit None, Las Vegas, NV 89115 and is currently priced at $392,136, approximately $201 per square foot. 4593 Chanted Heart Ave Unit None is a home located in Clark County with nearby schools including Zel & Mary Lowman Elementary School, J.E. Manch Elementary School, and Carroll M. Johnston STEM Academy of Environmental Studies.
Ownership History
Date
Name
Owned For
Owner Type
Purchase Details
Closed on
Apr 17, 2019
Sold by
Progress Residential Equity Owner 8 Llc
Bought by
Progress Residential Equity Owner 8 Llc
Current Estimated Value
Purchase Details
Closed on
Dec 28, 2012
Sold by
Tenev Llc
Bought by
Freo Nevada Llc
Purchase Details
Closed on
Jun 22, 2012
Sold by
Tendler Arie
Bought by
Tenev Llc
Purchase Details
Closed on
Oct 4, 2011
Sold by
Canon Daniel and Canon Joyce
Bought by
Tendler Arie
Purchase Details
Closed on
Jul 15, 2011
Sold by
The Secretary Of Housing & Urban Develop
Bought by
Canon Daniel and Canon Joyce
Purchase Details
Closed on
Jan 12, 2011
Sold by
Flagstar Bank Fsb
Bought by
United States Department Of Housing & Ur
Purchase Details
Closed on
Jul 1, 2010
Sold by
Calvo Soledad G and Calvo Asbikin A
Bought by
Flagstar Bank Fsb
Purchase Details
Closed on
Jul 3, 2008
Sold by
Devallejo Julia Guillen
Bought by
Calvo Soledad G and Calvo Asbikin A
Home Financials for this Owner
Home Financials are based on the most recent Mortgage that was taken out on this home.
Original Mortgage
$178,478
Interest Rate
6.04%
Mortgage Type
FHA
Purchase Details
Closed on
Mar 20, 2006
Sold by
Vallejo Miguel
Bought by
Devallejo Julia Guillen
Home Financials for this Owner
Home Financials are based on the most recent Mortgage that was taken out on this home.
Original Mortgage
$239,900
Interest Rate
7.25%
Mortgage Type
Balloon
Purchase Details
Closed on
Mar 13, 2006
Sold by
Gunderson Shannon
Bought by
Devallejo Julia Guillen
Home Financials for this Owner
Home Financials are based on the most recent Mortgage that was taken out on this home.
Original Mortgage
$239,900
Interest Rate
7.25%
Mortgage Type
Balloon
Purchase Details
Closed on
Nov 15, 2005
Sold by
Beazer Homes Holdings Corp
Bought by
Gunderson Shannon
Home Financials for this Owner
Home Financials are based on the most recent Mortgage that was taken out on this home.
Original Mortgage
$191,450
Interest Rate
8%
Mortgage Type
Fannie Mae Freddie Mac
Purchase Details
Closed on
Dec 28, 2004
Sold by
Plaster Development Co Inc
Bought by
Beazer Homes Holdings Corp
Create a Home Valuation Report for This Property
The Home Valuation Report is an in-depth analysis detailing your home's value as well as a comparison with similar homes in the area
Home Values in the Area
Average Home Value in this Area
Purchase History
| Date | Buyer | Sale Price | Title Company |
|---|---|---|---|
| Progress Residential Equity Owner 8 Llc | -- | Os National | |
| Progress Residential Equity Owner 8 Llc | -- | Os National | |
| Progress Res Intermediate Sfr Holdings L | -- | Os National | |
| Progress Residential Equity Owner 7 Llc | -- | Os National | |
| Freo Nevada Llc | $122,500 | Horizon National Title Insu | |
| Tenev Llc | $83,000 | None Available | |
| Tendler Arie | $83,000 | Lawyers Title Of Nevada Hen | |
| Canon Daniel | $82,000 | Nevada Title Las Vegas | |
| United States Department Of Housing & Ur | -- | First American National Def | |
| Flagstar Bank Fsb | $187,325 | First American National Def | |
| Calvo Soledad G | $181,000 | National Title Company | |
| Devallejo Julia Guillen | -- | Accommodation | |
| Devallejo Julia Guillen | $299,900 | Nevada Title Company | |
| Gunderson Shannon | $239,325 | First American Title Co Nv | |
| Beazer Homes Holdings Corp | $7,896,320 | Nevada Title Company |
Source: Public Records
Mortgage History
| Date | Status | Borrower | Loan Amount |
|---|---|---|---|
| Previous Owner | Calvo Soledad G | $178,478 | |
| Previous Owner | Devallejo Julia Guillen | $239,900 | |
| Previous Owner | Gunderson Shannon | $191,450 |
Source: Public Records
Tax History Compared to Growth
Tax History
| Year | Tax Paid | Tax Assessment Tax Assessment Total Assessment is a certain percentage of the fair market value that is determined by local assessors to be the total taxable value of land and additions on the property. | Land | Improvement |
|---|---|---|---|---|
| 2025 | $1,478 | $106,917 | $27,300 | $79,617 |
| 2024 | $1,369 | $106,917 | $27,300 | $79,617 |
| 2023 | $1,369 | $104,070 | $29,050 | $75,020 |
| 2022 | $1,268 | $91,165 | $22,750 | $68,415 |
| 2021 | $1,174 | $85,970 | $21,000 | $64,970 |
| 2020 | $1,088 | $83,558 | $19,250 | $64,308 |
| 2019 | $1,019 | $71,856 | $15,750 | $56,106 |
| 2018 | $973 | $59,848 | $12,250 | $47,598 |
| 2017 | $1,650 | $56,275 | $11,200 | $45,075 |
| 2016 | $912 | $47,021 | $7,000 | $40,021 |
| 2015 | $909 | $41,201 | $4,200 | $37,001 |
| 2014 | $881 | $31,396 | $4,200 | $27,196 |
Source: Public Records
Map
Nearby Homes
- 4271 Lemay St Unit 3
- 4278 Lemay St Unit 2
- 3937 Tatiana St
- 4004 Emerald Wood St
- 4734 Valleyside Ave
- 4121 Story Rock St
- 4349 Faberge Ave
- 4774 Valleyside Ave
- 3907 Lancome St
- 4311 Faberge Ave
- 4219 Studio St
- 0 Marion & Gowan Unit 2212764
- 4783 Corsaire Ave
- 3736 Steinbeck Dr
- 3829 N Nellis Blvd
- 4199 Dobson Dr
- 4323 Paramount St
- 4329 Studio St
- 4305 Puebla St
- 3485 Cactus Springs Dr
- 4593 Chanted Heart Ave
- 4587 Chanted Heart Ave
- 4599 Chanted Heart Ave
- 4581 Chanted Heart Ave
- 4605 Chanted Heart Ave
- 4575 Chanted Heart Ave
- 4611 Chanted Heart Ave
- 3923 Falling Heart Ct Unit none
- 4569 Chanted Heart Ave
- 4617 Chanted Heart Ave
- 3929 Falling Heart Ct
- 3926 Lonely Heart Ct
- 3932 Lonely Heart Ct
- 4563 Chanted Heart Ave
- 3924 Falling Heart Ct
- 4623 Chanted Heart Ave
- 3935 Falling Heart Ct
- 4563 Chanted Heart Ave
- 3930 Falling Heart Ct Unit none