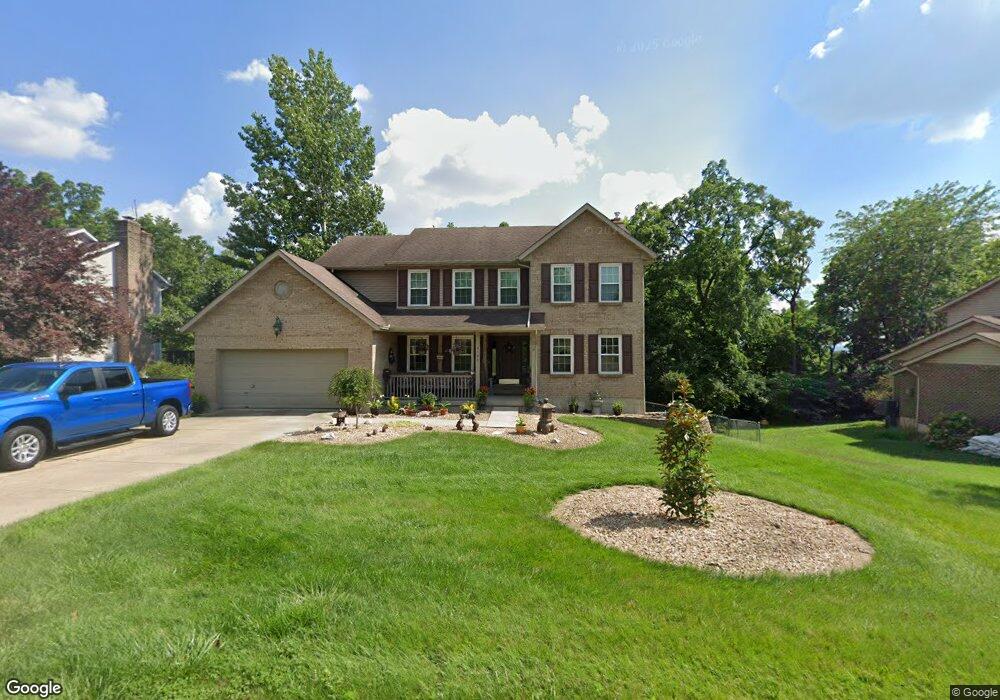
4593 Snowbird Dr Liberty Township, OH 45011
Estimated Value: $412,000 - $498,000
4
Beds
3
Baths
2,504
Sq Ft
$182/Sq Ft
Est. Value
About This Home
This home is located at 4593 Snowbird Dr, Liberty Township, OH 45011 and is currently estimated at $454,893, approximately $181 per square foot. 4593 Snowbird Dr is a home located in Butler County with nearby schools including Heritage Early Childhood School, Cherokee Elementary School, and Lakota Plains Junior School.
Ownership History
Date
Name
Owned For
Owner Type
Purchase Details
Closed on
Aug 28, 2003
Sold by
Scheie Andrew J and Scheie Lisa B
Bought by
Sandlin Mark and Sandlin Jacqueline
Current Estimated Value
Home Financials for this Owner
Home Financials are based on the most recent Mortgage that was taken out on this home.
Original Mortgage
$182,000
Outstanding Balance
$82,859
Interest Rate
5.97%
Mortgage Type
Purchase Money Mortgage
Estimated Equity
$372,034
Purchase Details
Closed on
Aug 29, 2000
Sold by
Hafer Martin A and Hafer Karen R
Bought by
Scheie Andrew J
Purchase Details
Closed on
Apr 19, 1996
Sold by
Landmark Communities Inc
Bought by
Hafer Martin A and Hafer Karen
Home Financials for this Owner
Home Financials are based on the most recent Mortgage that was taken out on this home.
Original Mortgage
$162,250
Interest Rate
7.44%
Mortgage Type
New Conventional
Purchase Details
Closed on
Jan 18, 1996
Sold by
Broshear Contractors Inc
Bought by
Landmark Communities Inc
Create a Home Valuation Report for This Property
The Home Valuation Report is an in-depth analysis detailing your home's value as well as a comparison with similar homes in the area
Home Values in the Area
Average Home Value in this Area
Purchase History
| Date | Buyer | Sale Price | Title Company |
|---|---|---|---|
| Sandlin Mark | $210,000 | -- | |
| Scheie Andrew J | $189,000 | -- | |
| Hafer Martin A | $180,329 | -- | |
| Landmark Communities Inc | $59,000 | -- |
Source: Public Records
Mortgage History
| Date | Status | Borrower | Loan Amount |
|---|---|---|---|
| Open | Sandlin Mark | $182,000 | |
| Previous Owner | Hafer Martin A | $162,250 |
Source: Public Records
Tax History Compared to Growth
Tax History
| Year | Tax Paid | Tax Assessment Tax Assessment Total Assessment is a certain percentage of the fair market value that is determined by local assessors to be the total taxable value of land and additions on the property. | Land | Improvement |
|---|---|---|---|---|
| 2024 | $5,426 | $139,210 | $14,630 | $124,580 |
| 2023 | $5,358 | $139,210 | $14,630 | $124,580 |
| 2022 | $4,393 | $89,380 | $14,630 | $74,750 |
| 2021 | $4,370 | $89,380 | $14,630 | $74,750 |
| 2020 | $4,484 | $89,380 | $14,630 | $74,750 |
| 2019 | $7,602 | $78,920 | $14,630 | $64,290 |
| 2018 | $4,421 | $78,920 | $14,630 | $64,290 |
| 2017 | $4,506 | $78,920 | $14,630 | $64,290 |
| 2016 | $3,935 | $68,500 | $14,630 | $53,870 |
| 2015 | $3,937 | $68,500 | $14,630 | $53,870 |
| 2014 | $4,193 | $68,500 | $14,630 | $53,870 |
| 2013 | $4,193 | $70,530 | $14,630 | $55,900 |
Source: Public Records
Map
Nearby Homes
- 4600 Snowbird Dr
- 6384 S Snowmass Dr
- 6406 Whippoorwill Way
- 6406 Whippoorwill Dr
- 4628 Beech Knoll Ln
- 4925 Fescue Dr
- 4832 Willow Ridge Dr
- 4864 Aspen Dr
- 6077 Snow Hill Dr
- 4983 Fescue Dr
- 4824 Aspen Dr
- 5001 Fescue Dr
- 4296 Moselle Dr
- 4300 Pheasant Trail Ct
- 4871 Imperial Dr
- 4893 Arena Ct
- 6093 Griffin Ct
- 4991 Arena Ct
- 4520 Logsdons Meadow Dr
- 1 Princeton Rd
- 4601 Snowbird Dr
- 4585 Snowbird Dr
- 4609 Snowbird Dr
- 4577 Snowbird Dr
- 6421 Willow Bend Dr
- 6431 Willow Bend Dr
- 6411 Willow Bend Dr
- 4592 Snowbird Dr
- 6441 Willow Bend Dr
- 4584 Snowbird Dr
- 4608 Snowbird Dr
- 4569 Snowbird Dr
- 4619 Snowbird Dr
- 4576 Snowbird Dr
- 4616 Snowbird Dr
- 6451 Willow Bend Dr
- 6401 Willow Bend Dr
- 4561 Snowbird Dr
- 4629 Snowbird Dr
- 4568 Snowbird Dr