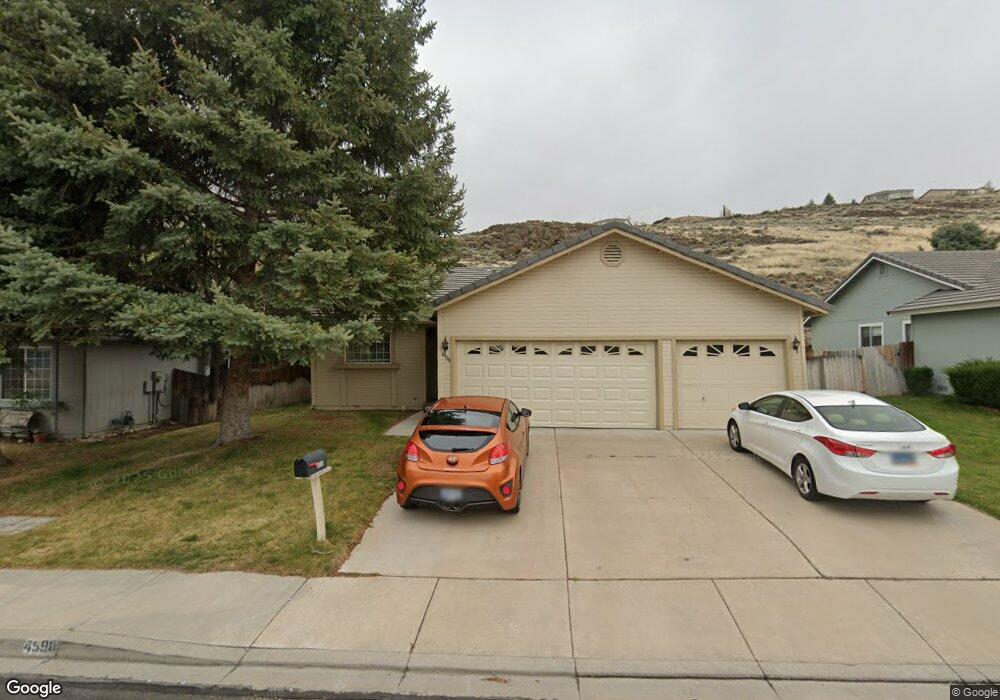
4598 Goodwin Rd Sparks, NV 89436
Los Altos Parkway NeighborhoodEstimated Value: $476,296 - $507,000
3
Beds
2
Baths
1,310
Sq Ft
$378/Sq Ft
Est. Value
About This Home
This home is located at 4598 Goodwin Rd, Sparks, NV 89436 and is currently estimated at $495,074, approximately $377 per square foot. 4598 Goodwin Rd is a home located in Washoe County with nearby schools including Bud Beasley Elementary School, Lou Mendive Middle School, and Edward C Reed High School.
Ownership History
Date
Name
Owned For
Owner Type
Purchase Details
Closed on
May 31, 2022
Sold by
Ardern Richard B and Ardern Joyce A
Bought by
Ardern Family Trust
Current Estimated Value
Purchase Details
Closed on
Mar 7, 2002
Sold by
Ardern Richard B and Ardern Joyce A
Bought by
Ardern Richard B and Ardern Joyce A
Home Financials for this Owner
Home Financials are based on the most recent Mortgage that was taken out on this home.
Original Mortgage
$103,000
Interest Rate
6.94%
Purchase Details
Closed on
Jun 27, 1997
Sold by
Ardern Richard B and Ardern Joyce A
Bought by
Ardern Richard B and Ardern Joyce A
Purchase Details
Closed on
Jan 13, 1997
Sold by
Barker Homes Inc
Bought by
Ardern Richard B and Ardern Joyce A
Home Financials for this Owner
Home Financials are based on the most recent Mortgage that was taken out on this home.
Original Mortgage
$104,230
Interest Rate
7.53%
Create a Home Valuation Report for This Property
The Home Valuation Report is an in-depth analysis detailing your home's value as well as a comparison with similar homes in the area
Home Values in the Area
Average Home Value in this Area
Purchase History
| Date | Buyer | Sale Price | Title Company |
|---|---|---|---|
| Ardern Family Trust | -- | Titus Brueckner & Levine Plc | |
| Ardern Richard B | -- | Titus Brueckner & Levine Plc | |
| Ardern Richard B | $169,500 | Stewart Title Northern Nevad | |
| Ardern Richard B | -- | -- | |
| Ardern Richard B | $149,000 | Stewart Title |
Source: Public Records
Mortgage History
| Date | Status | Borrower | Loan Amount |
|---|---|---|---|
| Previous Owner | Ardern Richard B | $103,000 | |
| Previous Owner | Ardern Richard B | $104,230 |
Source: Public Records
Tax History Compared to Growth
Tax History
| Year | Tax Paid | Tax Assessment Tax Assessment Total Assessment is a certain percentage of the fair market value that is determined by local assessors to be the total taxable value of land and additions on the property. | Land | Improvement |
|---|---|---|---|---|
| 2025 | $2,402 | $96,729 | $40,432 | $56,297 |
| 2024 | $2,402 | $93,711 | $38,071 | $55,640 |
| 2023 | $2,333 | $89,573 | $36,775 | $52,799 |
| 2022 | $2,266 | $75,374 | $31,189 | $44,185 |
| 2021 | $2,201 | $66,701 | $22,643 | $44,058 |
| 2020 | $2,138 | $66,857 | $22,610 | $44,247 |
| 2019 | $2,036 | $65,349 | $23,142 | $42,207 |
| 2018 | $1,943 | $58,250 | $16,891 | $41,359 |
| 2017 | $1,864 | $57,122 | $15,628 | $41,494 |
| 2016 | $1,814 | $56,242 | $13,799 | $42,443 |
| 2015 | $1,811 | $54,676 | $12,236 | $42,440 |
| 2014 | $1,762 | $51,463 | $10,341 | $41,122 |
| 2013 | -- | $46,677 | $8,479 | $38,198 |
Source: Public Records
Map
Nearby Homes
- 4383 Setting Sun Ct Unit 1
- 4670 High Desert Ct
- 1850 Almonte Ct
- 4601 N Cactus Hills Ct
- 1685 Southview Dr
- 4630 Firtree Ln
- 4393 Acobat Ct
- 1550 Istrice Rd
- 2411 Tecumseh Way Unit 12
- 2415 Tecumseh Way
- 2427 Tecumseh Way Unit 8
- 1560 Freeman Way
- 2738 Kettle Ct
- 4677 High Pass Ct
- 1484 Serendipity Ct
- 1557 Satellite Dr
- 4797 High Pass Dr
- 1716 Canyon Terrace Dr
- 1475 Golddust Dr
- 3324 Danville Dr
- 4592 Goodwin Rd
- 4602 Goodwin Rd
- 4588 Goodwin Rd
- 4610 Goodwin Rd
- 1995 High Desert Dr
- 4605 Goodwin Rd
- 4589 Goodwin Rd
- 4580 Goodwin Rd
- 4620 Goodwin Rd
- 1955 High Desert Dr
- 4585 Goodwin Rd
- 4578 Goodwin Rd
- 4628 Goodwin Rd
- 4620 Vista Mountain Dr
- 4579 Goodwin Rd
- 1905 High Desert Dr
- 4586 Vista Mountain Dr
- 4574 Goodwin Rd
- 4625 Goodwin Rd
- 4575 Goodwin Rd