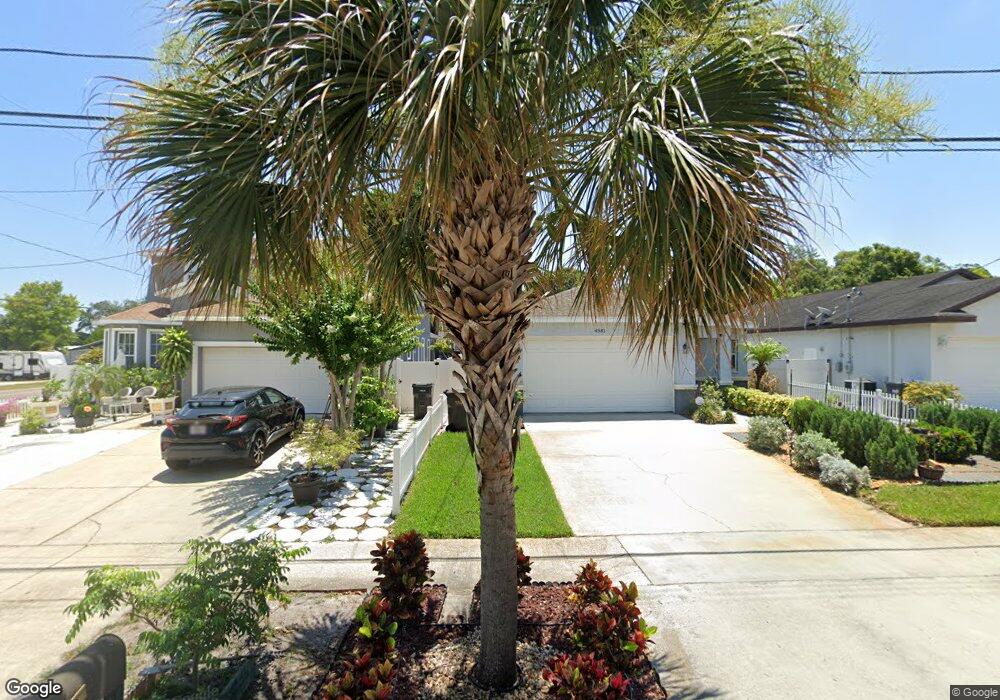
4599 46 St. Petersburg, FL 33714
Estimated Value: $564,000 - $611,000
4
Beds
3
Baths
2,420
Sq Ft
$240/Sq Ft
Est. Value
About This Home
This home is located at 4599 46, St. Petersburg, FL 33714 and is currently estimated at $581,128, approximately $240 per square foot. 4599 46 is a home located in Pinellas County with nearby schools including Westgate Elementary School, Tyrone Middle School, and St. Petersburg High School.
Ownership History
Date
Name
Owned For
Owner Type
Purchase Details
Closed on
Sep 29, 2021
Sold by
Mach Duke N and Vo Mach Kim Loan
Bought by
Mai Cong Viet and Vu Thi Kim
Current Estimated Value
Home Financials for this Owner
Home Financials are based on the most recent Mortgage that was taken out on this home.
Original Mortgage
$375,000
Outstanding Balance
$341,965
Interest Rate
2.8%
Mortgage Type
Purchase Money Mortgage
Estimated Equity
$239,163
Purchase Details
Closed on
Nov 24, 2009
Sold by
Qt Homes Inc
Bought by
Mach Duke N and Mach Kim Loan Vo
Home Financials for this Owner
Home Financials are based on the most recent Mortgage that was taken out on this home.
Original Mortgage
$184,000
Interest Rate
4.94%
Mortgage Type
New Conventional
Purchase Details
Closed on
Sep 29, 2006
Sold by
Chandley David
Bought by
Qt Homes Inc
Purchase Details
Closed on
Aug 14, 2000
Sold by
Chandley John
Bought by
Chandley David
Purchase Details
Closed on
Aug 24, 1994
Sold by
Wilson Barbara and Laughlin Phyllis
Bought by
Chandley David and Chandley John
Create a Home Valuation Report for This Property
The Home Valuation Report is an in-depth analysis detailing your home's value as well as a comparison with similar homes in the area
Home Values in the Area
Average Home Value in this Area
Purchase History
| Date | Buyer | Sale Price | Title Company |
|---|---|---|---|
| Mai Cong Viet | $445,000 | Barnes Walker Title Inc | |
| Mach Duke N | $230,000 | Sunburst Title Agency Inc | |
| Qt Homes Inc | $378,000 | Fidelity Natl Title Ins Co | |
| Chandley David | -- | -- | |
| Chandley David | -- | -- |
Source: Public Records
Mortgage History
| Date | Status | Borrower | Loan Amount |
|---|---|---|---|
| Open | Mai Cong Viet | $375,000 | |
| Previous Owner | Mach Duke N | $184,000 |
Source: Public Records
Tax History Compared to Growth
Tax History
| Year | Tax Paid | Tax Assessment Tax Assessment Total Assessment is a certain percentage of the fair market value that is determined by local assessors to be the total taxable value of land and additions on the property. | Land | Improvement |
|---|---|---|---|---|
| 2024 | $10,374 | $538,779 | $105,798 | $432,981 |
| 2023 | $10,374 | $516,908 | $114,485 | $402,423 |
| 2022 | $9,283 | $411,309 | $98,113 | $313,196 |
| 2021 | $3,767 | $193,771 | $0 | $0 |
| 2020 | $3,748 | $191,096 | $0 | $0 |
| 2019 | $3,678 | $186,800 | $0 | $0 |
| 2018 | $3,622 | $183,317 | $0 | $0 |
| 2017 | $3,578 | $179,547 | $0 | $0 |
| 2016 | $3,377 | $175,854 | $0 | $0 |
| 2015 | $3,395 | $174,632 | $0 | $0 |
| 2014 | -- | $173,246 | $0 | $0 |
Source: Public Records
Map
Nearby Homes
- 4530 45th Ave N
- 4753 48th Ave N
- 4359 45th Ave N
- 4320 46th Ave N
- 4390 44th St N
- 4485 49th Ave N
- 4409 43rd St N
- 4611 41st Ave N
- 4641 41st Ave N
- 4510 41st Ave N
- 4941 43rd Ave N
- 4500 51st Ct N
- 4960 44th Ave N
- 4964 44th Ave N
- 5183 Orange Blossom Ln N
- 4071 45th Ave N
- 5127 46th Ave N
- 4049 45th Ave N
- 3846 Tifton St N
- 4081 41st Ave N
- 4599 46th St N
- 4581 46th St N
- 4561 46th St N
- 4540 46th Ave N
- 4602 46th Ave N
- 4541 46th St N
- 4612 46th Ave N
- 4522 46th Ave N
- 4575 46th Ave N
- 4521 46th St N
- 4519 46th St N
- 4525 45th Ave N
- 4510 46th Ave N
- 4525 46th Ave N
- 4521 45th Ave N
- 4608 46th St N
- 4505 45th Ave N
- 4515 46th Ave N
- 0 46th St N Unit U7793791