Estimated Value: $369,000 - $399,000
4
Beds
2
Baths
1,492
Sq Ft
$261/Sq Ft
Est. Value
About This Home
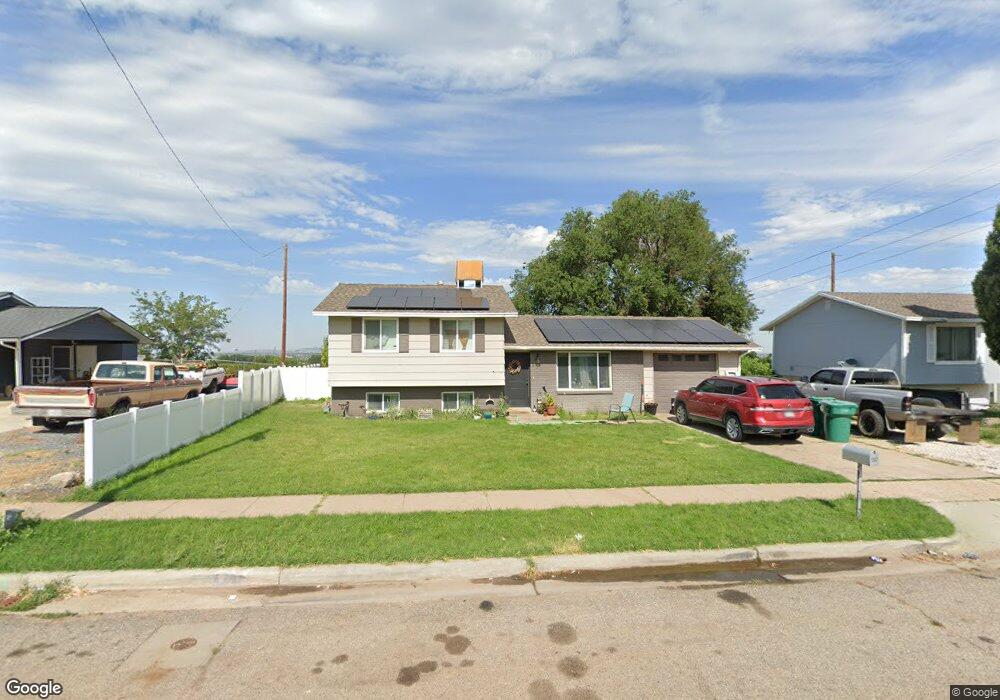
This home is located at 4599 S 2675 W, Roy, UT 84067 and is currently estimated at $388,826, approximately $260 per square foot. 4599 S 2675 W is a home located in Weber County with nearby schools including Valley View School, Sand Ridge Junior High School, and Roy High School.
Ownership History
Date
Name
Owned For
Owner Type
Purchase Details
Closed on
Jul 19, 2017
Sold by
Miller Lance G
Bought by
Clark Dustin and Clark Antonette
Current Estimated Value
Home Financials for this Owner
Home Financials are based on the most recent Mortgage that was taken out on this home.
Original Mortgage
$194,000
Outstanding Balance
$161,181
Interest Rate
3.89%
Mortgage Type
New Conventional
Estimated Equity
$227,645
Purchase Details
Closed on
May 28, 2014
Sold by
Bluemel Brock T and Bluemel Jamie L
Bought by
Augusta Investment Management Llc
Purchase Details
Closed on
Mar 23, 2005
Sold by
Williams Michael E and Williams Kimberly
Bought by
Bluemel Brock T and Bluemel Jamie L
Create a Home Valuation Report for This Property
The Home Valuation Report is an in-depth analysis detailing your home's value as well as a comparison with similar homes in the area
Home Values in the Area
Average Home Value in this Area
Purchase History
| Date | Buyer | Sale Price | Title Company |
|---|---|---|---|
| Clark Dustin | -- | Mountain View Title | |
| Augusta Investment Management Llc | $93,696 | Accommodation | |
| Bluemel Brock T | -- | Heritage West Title Insuranc |
Source: Public Records
Mortgage History
| Date | Status | Borrower | Loan Amount |
|---|---|---|---|
| Open | Clark Dustin | $194,000 |
Source: Public Records
Tax History
| Year | Tax Paid | Tax Assessment Tax Assessment Total Assessment is a certain percentage of the fair market value that is determined by local assessors to be the total taxable value of land and additions on the property. | Land | Improvement |
|---|---|---|---|---|
| 2025 | $2,367 | $370,792 | $92,325 | $278,467 |
| 2024 | $2,307 | $200,199 | $50,778 | $149,421 |
| 2023 | $2,262 | $196,900 | $50,934 | $145,966 |
| 2022 | $2,153 | $191,950 | $46,424 | $145,526 |
| 2021 | $1,762 | $257,000 | $58,973 | $198,027 |
| 2020 | $1,709 | $230,000 | $58,973 | $171,027 |
| 2019 | $1,603 | $202,000 | $33,575 | $168,425 |
| 2018 | $1,485 | $175,000 | $31,901 | $143,099 |
| 2017 | $1,290 | $140,000 | $29,394 | $110,606 |
| 2016 | $1,307 | $76,825 | $15,791 | $61,034 |
| 2015 | $1,070 | $62,608 | $15,791 | $46,817 |
| 2014 | $969 | $54,969 | $15,791 | $39,178 |
Source: Public Records
Map
Nearby Homes
- 2602 W 4600 S
- 2953 W 4650 S
- 4881 S 2400 W
- 3022 W 4750 S
- 2815 W 4275 S
- 4891 S 2875 W
- 4374 S 2900 W
- 4793 S 3025 W
- 4270 S 2900 W
- 4248 S 2400 W
- 5063 S 2825 W
- 2778 W 4175 S Unit 237
- 5125 S 2600 W
- 2338 W 4250 S
- 4328 S 2175 W
- 2568 W 5225 S
- 5141 S 2975 W
- 2038 W 4600 S
- 2015 W 4450 S
- 4435 Cross Creek Rd Unit 29C
- 4605 S 2675 W
- 4581 S 2675 W
- 4609 S 2675 W
- 4582 S 2675 W
- 4602 S 2675 W
- 4563 S 2675 W
- 2662 W 4600 S
- 4629 S 2675 W
- 4608 S 2675 W
- 4608 S 2675 W Unit 6
- 4576 S West Park Dr
- 4606 S West Park Dr
- 2648 W 4600 S
- 2661 W 4600 S
- 4551 S 2675 W
- 4630 S 2675 W
- 4630 S 2675 W Unit 7
- 4552 S 2675 W
- 4598 S West Park Dr
- 4651 S 2675 W
Your Personal Tour Guide
Ask me questions while you tour the home.