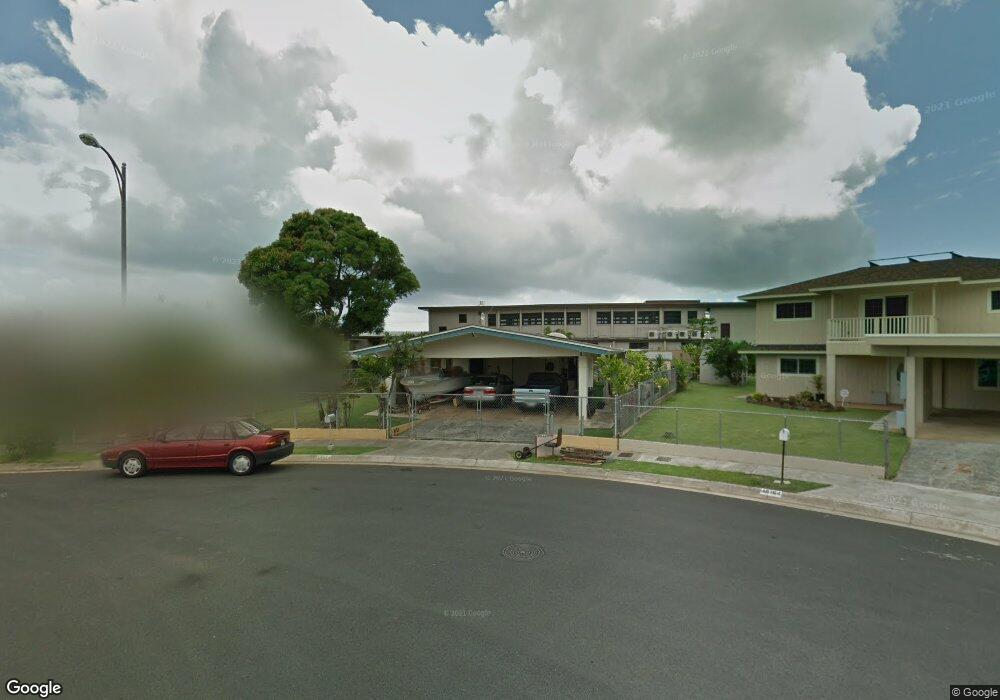
46-162 Nona Loop Kaneohe, HI 96744
Estimated Value: $1,053,000 - $1,260,000
3
Beds
2
Baths
1,548
Sq Ft
$745/Sq Ft
Est. Value
About This Home
This home is located at 46-162 Nona Loop, Kaneohe, HI 96744 and is currently estimated at $1,153,228, approximately $744 per square foot. 46-162 Nona Loop is a home located in Honolulu County with nearby schools including Heeia Elementary School, Governor Samuel Wilder King Intermediate School, and Castle High School.
Ownership History
Date
Name
Owned For
Owner Type
Purchase Details
Closed on
Sep 22, 2020
Sold by
Bow Kimberlee Lahela Ahnee
Bought by
Kimberlee Lahela Ahnee Bow Revocable Living T and Bow
Current Estimated Value
Purchase Details
Closed on
Aug 24, 2020
Sold by
Costello Kaylynn Piike Ung
Bought by
Kaylynn Piikea Ung Costello Revocable Living and Costello
Purchase Details
Closed on
Mar 7, 2018
Sold by
Costello Kaylynn Piikea Ung and Bow Kimberlee Lahela Ahnee
Bought by
Costello Kaylynn Piikea Ung and Morrill Tania Piilani Oi
Purchase Details
Closed on
May 16, 2003
Sold by
Bow Raymond Hong Yen and Bow Primrose Mary
Bought by
Bow Raymond H Y and Raymond H Y Bow Revocable Living Trust
Purchase Details
Closed on
Jan 28, 1998
Sold by
Lizama Evangeline R
Bought by
Debusca Gertrude and Enoka William Joseph
Create a Home Valuation Report for This Property
The Home Valuation Report is an in-depth analysis detailing your home's value as well as a comparison with similar homes in the area
Home Values in the Area
Average Home Value in this Area
Purchase History
| Date | Buyer | Sale Price | Title Company |
|---|---|---|---|
| Kimberlee Lahela Ahnee Bow Revocable Living T | -- | Title Guaranty | |
| Bow Kimberlee Lahela Ahnee | -- | Tg | |
| Bow Kimberlee Lahela Ahnee | -- | Tg | |
| Kaylynn Piikea Ung Costello Revocable Living | -- | Title Guaranty & Escrow Servic | |
| Costello Kaylynn Piikea Ung | -- | Tg | |
| Costello Kaylynn Piikea Ung | -- | Tg | |
| Costello Kaylynn Piikea Ung | -- | None Available | |
| Bow Raymond H Y | -- | -- | |
| Debusca Gertrude | -- | -- | |
| Lizama Evangeline R | -- | -- | |
| Lizama Joseph B | -- | -- |
Source: Public Records
Tax History Compared to Growth
Tax History
| Year | Tax Paid | Tax Assessment Tax Assessment Total Assessment is a certain percentage of the fair market value that is determined by local assessors to be the total taxable value of land and additions on the property. | Land | Improvement |
|---|---|---|---|---|
| 2025 | $2,985 | $1,047,100 | $899,700 | $147,400 |
| 2024 | $2,985 | $972,800 | $863,700 | $109,100 |
| 2023 | $2,778 | $993,700 | $874,000 | $119,700 |
| 2022 | $2,811 | $903,100 | $796,900 | $106,200 |
| 2021 | $2,653 | $858,100 | $745,500 | $112,600 |
| 2020 | $2,693 | $869,500 | $719,800 | $149,700 |
| 2019 | $2,682 | $846,300 | $688,900 | $157,400 |
| 2018 | $2,741 | $783,200 | $669,100 | $114,100 |
| 2017 | $2,708 | $773,600 | $535,300 | $238,300 |
| 2016 | $2,162 | $737,800 | $535,300 | $202,500 |
| 2015 | $1,893 | $660,800 | $455,000 | $205,800 |
| 2014 | -- | $623,700 | $428,000 | $195,700 |
Source: Public Records
Map
Nearby Homes
- 46-145 Haiku Rd
- 46-145 Humu Place
- 46-171 Hinalani St
- 46-130 Kiowai St Unit 2724
- 46-130 Kiowai St Unit 2717
- 46-160 Kiowai St Unit 2324
- 46-058 Aliikane Place Unit 2123
- 46-48 Aliikane Place Unit 2216
- 46-036 Aliikane Place Unit 522
- 46-010 Aliikane Place Unit 212
- 46-1033 Emepela Way Unit 16
- 46-1006 Emepela Way Unit 24
- 46-239 Haiku Rd
- 46-276 Nahewai St
- 46-44 Puulena St Unit 812
- 46-222 Ahui Nani Place
- 45-521 Pahia Rd Unit C
- 45-521 Pahia Rd
- 46-1016 Emepela Way Unit 22
- 46-1059 Emepela Way Unit 4U
- 46-160 Nona Loop
- 46-164 Nona Loop
- 46-158 Nona Loop
- 46-166 Nona Loop
- 46-167 Nona Loop
- 46-161 Nona Loop
- 46-168 Nona Loop
- 46-154 Nona Loop
- 46-137 Haiku Rd
- 46-157 Nona Loop
- 46-139 Haiku Rd
- 46-143 Haiku Rd
- 46-170 Nona Loop
- 46-150 Nona Loop
- 46-171 Nona Loop
- 46-153 Nona Loop
- 46-149 Haiku Rd
- 46-183 Nona Loop
- 46-129 Haiku Rd
- 46-172 Nona Loop