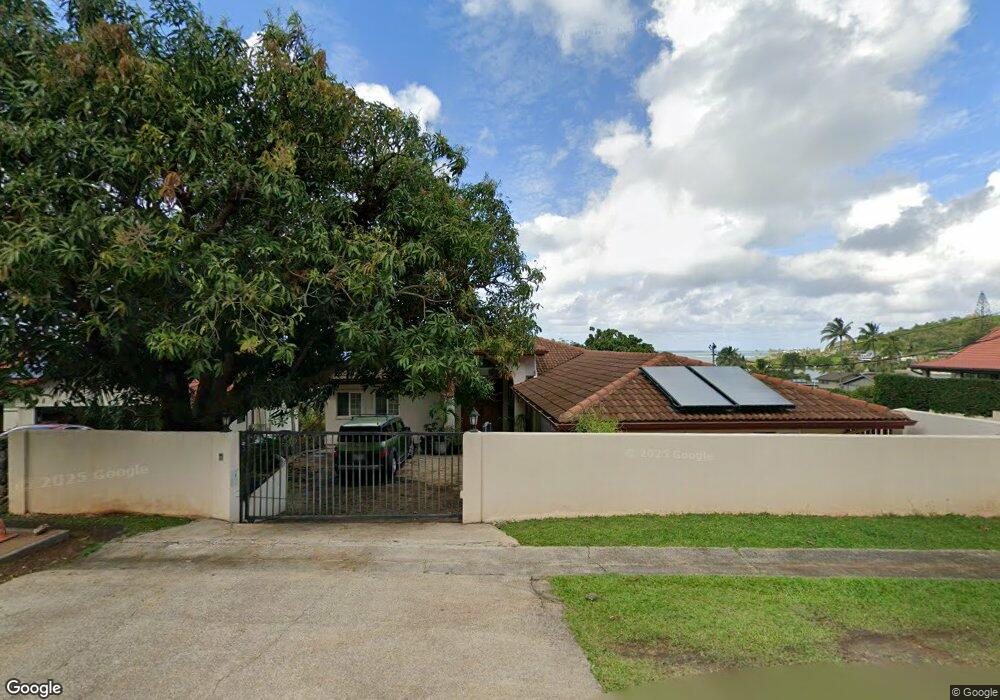
46-179 Lilipuna Rd Kaneohe, HI 96744
Estimated Value: $1,251,000 - $3,208,000
4
Beds
3
Baths
2,159
Sq Ft
$1,022/Sq Ft
Est. Value
About This Home
This home is located at 46-179 Lilipuna Rd, Kaneohe, HI 96744 and is currently estimated at $2,205,964, approximately $1,021 per square foot. 46-179 Lilipuna Rd is a home located in Honolulu County with nearby schools including Heeia Elementary School, Governor Samuel Wilder King Intermediate School, and Castle High School.
Ownership History
Date
Name
Owned For
Owner Type
Purchase Details
Closed on
Aug 24, 2021
Sold by
Samaha Thomas Joseph and Allison Marie
Bought by
Thomas And Allison Samaha Living Trust and Samaha
Current Estimated Value
Purchase Details
Closed on
Jun 3, 2018
Sold by
Samaha Allison M and Edward Moy Revocable Trust
Bought by
Samaha Thomas Joseph and Samaha Allison Marie
Purchase Details
Closed on
Apr 25, 2007
Sold by
Moy Edward
Bought by
Moy Edward and Edward Moy Revocable Trust
Purchase Details
Closed on
Apr 24, 2001
Sold by
Moy Edward and Moy Albert Joseph
Bought by
Moy Edward
Create a Home Valuation Report for This Property
The Home Valuation Report is an in-depth analysis detailing your home's value as well as a comparison with similar homes in the area
Home Values in the Area
Average Home Value in this Area
Purchase History
| Date | Buyer | Sale Price | Title Company |
|---|---|---|---|
| Thomas And Allison Samaha Living Trust | -- | None Listed On Document | |
| Thomas And Allison Samaha Living Trust | -- | None Listed On Document | |
| Thomas And Allison Samaha Living Trust | -- | None Listed On Document | |
| Samaha Thomas J | -- | None Available | |
| Samaha Thomas J | -- | None Available | |
| Samaha Thomas J | -- | None Available | |
| Samaha Thomas J | -- | None Available | |
| Samaha Thomas J | -- | None Available | |
| Samaha Thomas Joseph | -- | None Available | |
| Samaha Thomas Joseph | -- | None Available | |
| Moy Edward | -- | None Available | |
| Moy Edward | -- | -- |
Source: Public Records
Tax History Compared to Growth
Tax History
| Year | Tax Paid | Tax Assessment Tax Assessment Total Assessment is a certain percentage of the fair market value that is determined by local assessors to be the total taxable value of land and additions on the property. | Land | Improvement |
|---|---|---|---|---|
| 2025 | $14,241 | $2,221,100 | $1,236,500 | $984,600 |
| 2024 | $14,241 | $1,898,300 | $1,236,500 | $661,800 |
| 2023 | $14,993 | $1,964,300 | $1,043,300 | $921,000 |
| 2022 | $12,759 | $1,786,600 | $927,400 | $859,200 |
| 2021 | $11,126 | $1,631,000 | $850,100 | $780,900 |
| 2020 | $11,277 | $1,645,400 | $850,100 | $795,300 |
| 2019 | $5,033 | $1,628,200 | $826,900 | $801,300 |
| 2018 | $5,033 | $1,558,100 | $811,400 | $746,700 |
| 2017 | $4,722 | $1,469,000 | $734,200 | $734,800 |
| 2016 | $1,691 | $1,380,200 | $695,500 | $684,700 |
| 2015 | $3,950 | $1,248,700 | $656,900 | $591,800 |
| 2014 | -- | $1,365,900 | $572,700 | $793,200 |
Source: Public Records
Map
Nearby Homes
- 46-074 Puulena St Unit 1111
- 46-44 Puulena St Unit 812
- 46-130 Kiowai St Unit 2724
- 46-130 Kiowai St Unit 2717
- 46-48 Aliikane Place Unit 2216
- 46-160 Kiowai St Unit 2324
- 46-058 Aliikane Place Unit 2123
- 46-109 Konohiki St Unit 3934
- 46-109 Konohiki St Unit 3913
- 46-109 Konohiki St Unit 3922
- 45-315 Lilipuna Rd Unit A306
- 46-010 Aliikane Place Unit 212
- 45-185 Lilipuna Rd Unit A
- 46-036 Aliikane Place Unit 522
- 45-342 Lilipuna Rd Unit 204
- 46-145 Humu Place
- 46-050 Konane Place Unit 3711
- 46-035 Konohiki St Unit 3832
- 45-081 Lilipuna Rd Unit G
- 45-074 Lilipuna Rd Unit A
- 46-183 Lilipuna Rd
- 46-171 Lilipuna Rd
- 46-174 Yacht Club St
- 46-187 Lilipuna Rd
- 46-178 Yacht Club St
- 46-172 Yacht Club St
- 46-182 Yacht Club St
- 46-169 Lilipuna Rd
- 46-170 Yacht Club St
- 46-182 Lilipuna Rd
- 46-180 Lilipuna Rd
- 46-191 Lilipuna Rd
- 46-186 Yacht Club St
- 46-176 Lilipuna Rd
- 46-184 Lilipuna Rd
- 46-166 Yacht Club St
- 46-165 Lilipuna Rd
- 46-172 Lilipuna Rd
- 46-188 Lilipuna Rd
- 46-190 Yacht Club St