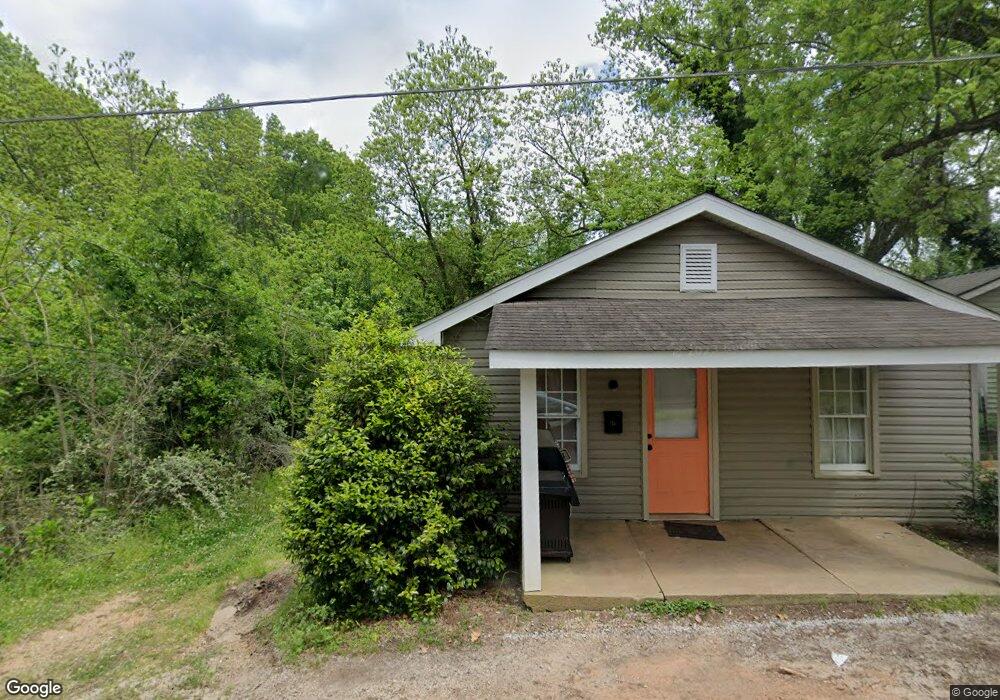
46 Aaron St Royston, GA 30662
Estimated Value: $65,926 - $113,000
2
Beds
1
Bath
588
Sq Ft
$167/Sq Ft
Est. Value
About This Home
This home is located at 46 Aaron St, Royston, GA 30662 and is currently estimated at $97,982, approximately $166 per square foot. 46 Aaron St is a home located in Franklin County with nearby schools including Franklin County High School, Grace Ranch Academy, and Cornerstone Christian Academy.
Ownership History
Date
Name
Owned For
Owner Type
Purchase Details
Closed on
May 19, 2022
Sold by
Finley Chuck E
Bought by
Franklin Rents Llc
Current Estimated Value
Purchase Details
Closed on
Mar 24, 2010
Sold by
379 Investments Llc
Bought by
Finley Chuck E
Purchase Details
Closed on
Dec 9, 2009
Sold by
Afb
Bought by
379 Investments Llc
Purchase Details
Closed on
May 5, 2009
Sold by
Eclipse Properties Llc
Bought by
Afb
Purchase Details
Closed on
Sep 11, 2006
Sold by
Snelling Matthew and Snelling M. Masa
Bought by
Eclipse Properties Llc
Purchase Details
Closed on
Mar 9, 2005
Sold by
Smith Kenneth L
Bought by
Snelling Matthew and Masa Kenney M
Purchase Details
Closed on
Apr 17, 2003
Sold by
Smith Joshua L
Bought by
Smith Kenneth L
Purchase Details
Closed on
Nov 12, 2001
Sold by
King Jerry D Jame
Bought by
Smith Joshua L
Purchase Details
Closed on
May 18, 1994
Bought by
King Jerry D James
Create a Home Valuation Report for This Property
The Home Valuation Report is an in-depth analysis detailing your home's value as well as a comparison with similar homes in the area
Home Values in the Area
Average Home Value in this Area
Purchase History
| Date | Buyer | Sale Price | Title Company |
|---|---|---|---|
| Franklin Rents Llc | $20,000 | -- | |
| Finley Chuck E | -- | -- | |
| Finley Chuck E | -- | -- | |
| 379 Investments Llc | $11,500 | -- | |
| 379 Investments Llc | $11,500 | -- | |
| Afb | -- | -- | |
| Eclipse Properties Llc | -- | -- | |
| Snelling Matthew | $80,000 | -- | |
| Smith Kenneth L | -- | -- | |
| Smith Joshua L | $58,000 | -- | |
| King Jerry D James | -- | -- |
Source: Public Records
Tax History
| Year | Tax Paid | Tax Assessment Tax Assessment Total Assessment is a certain percentage of the fair market value that is determined by local assessors to be the total taxable value of land and additions on the property. | Land | Improvement |
|---|---|---|---|---|
| 2025 | $309 | $9,648 | $1,200 | $8,448 |
| 2024 | $306 | $8,902 | $1,200 | $7,702 |
| 2023 | $302 | $8,202 | $1,200 | $7,002 |
| 2022 | $203 | $7,562 | $1,200 | $6,362 |
| 2021 | $205 | $7,203 | $760 | $6,443 |
| 2020 | $132 | $4,560 | $760 | $3,800 |
| 2019 | $128 | $4,560 | $760 | $3,800 |
| 2018 | $118 | $4,200 | $760 | $3,440 |
| 2017 | $122 | $4,200 | $760 | $3,440 |
| 2016 | $120 | $3,963 | $760 | $3,203 |
| 2015 | -- | $5,318 | $760 | $4,558 |
| 2014 | -- | $5,318 | $760 | $4,558 |
| 2013 | -- | $5,404 | $760 | $4,644 |
Source: Public Records
Map
Nearby Homes
- 0 Grove St Unit 10688565
- 133 Allen St
- 340 Floyd St
- 134 College St
- 285 Bowers St
- 15 Putnam St
- LOT 6 Pine Valley Dr
- 857 College St
- 134 Hope St
- 121 Cook St
- 527 Daniel St
- 0 Wildcat Bridge Rd Unit 23872265
- 0 Wildcat Bridge Rd Unit 10544672
- 267 Adams Place Dr
- 0 Harper Ln Unit 10672727
- 0 Hwy 17 Unit 10630850
- 0 Hwy 17 Unit 10630342
- 00 Georgia 17
- 357 Woodridge Way
- 40 Burch St
Your Personal Tour Guide
Ask me questions while you tour the home.