46 Adams St Lynn, MA 01902
Highlands NeighborhoodEstimated Value: $466,000 - $569,000
3
Beds
1
Bath
1,256
Sq Ft
$409/Sq Ft
Est. Value
About This Home
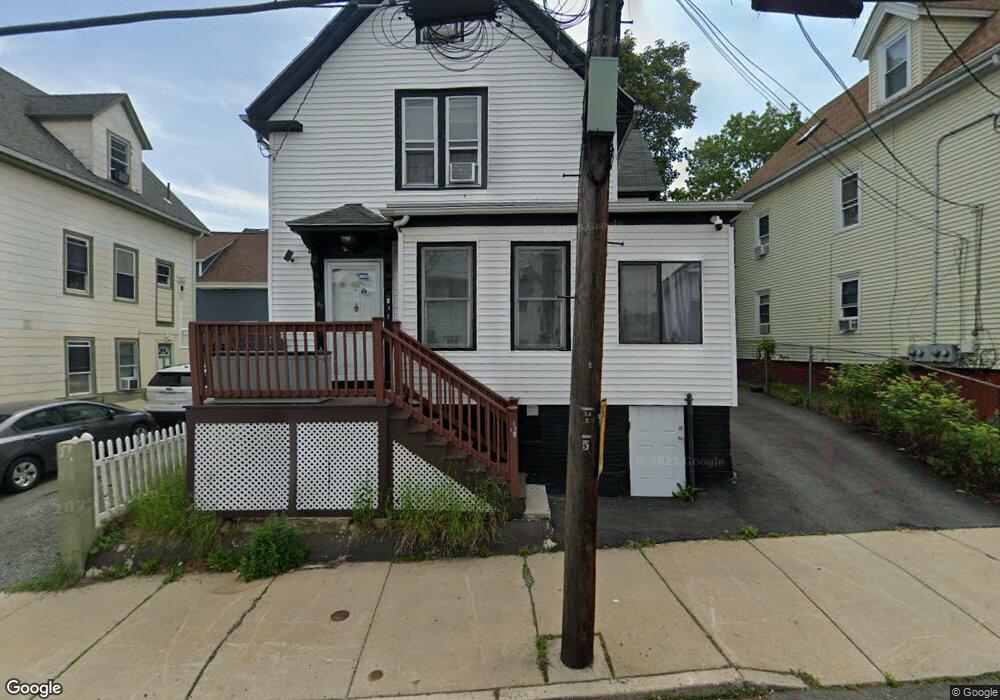
This home is located at 46 Adams St, Lynn, MA 01902 and is currently estimated at $513,781, approximately $409 per square foot. 46 Adams St is a home located in Essex County with nearby schools including Ingalls Elementary School, William R. Fallon School, and Marshall Middle School.
Ownership History
Date
Name
Owned For
Owner Type
Purchase Details
Closed on
Oct 30, 2020
Sold by
Cordy Majorie A
Bought by
Cordy Marjorie A and Cormier Patricia L
Current Estimated Value
Purchase Details
Closed on
Aug 17, 2004
Sold by
Cordy Majorie A and Flowers Patricia C
Bought by
Cordy Majorie A
Create a Home Valuation Report for This Property
The Home Valuation Report is an in-depth analysis detailing your home's value as well as a comparison with similar homes in the area
Home Values in the Area
Average Home Value in this Area
Purchase History
| Date | Buyer | Sale Price | Title Company |
|---|---|---|---|
| Cordy Marjorie A | -- | None Available | |
| Cordy Majorie A | -- | -- |
Source: Public Records
Mortgage History
| Date | Status | Borrower | Loan Amount |
|---|---|---|---|
| Previous Owner | Cordy Majorie A | $200,600 | |
| Previous Owner | Cordy Majorie A | $180,000 |
Source: Public Records
Tax History Compared to Growth
Tax History
| Year | Tax Paid | Tax Assessment Tax Assessment Total Assessment is a certain percentage of the fair market value that is determined by local assessors to be the total taxable value of land and additions on the property. | Land | Improvement |
|---|---|---|---|---|
| 2025 | $4,811 | $464,400 | $183,800 | $280,600 |
| 2024 | $4,532 | $430,400 | $165,900 | $264,500 |
| 2023 | $4,421 | $396,500 | $165,900 | $230,600 |
| 2022 | $4,234 | $340,600 | $135,700 | $204,900 |
| 2021 | $4,095 | $314,300 | $123,700 | $190,600 |
| 2020 | $3,639 | $271,600 | $96,700 | $174,900 |
| 2019 | $3,695 | $258,400 | $94,300 | $164,100 |
| 2018 | $3,439 | $227,000 | $91,100 | $135,900 |
| 2017 | $3,061 | $196,200 | $70,800 | $125,400 |
| 2016 | $2,875 | $177,700 | $59,700 | $118,000 |
| 2015 | $2,789 | $166,500 | $64,100 | $102,400 |
Source: Public Records
Map
Nearby Homes
- 94 Sheridan St
- 30 Adams St
- 16 Hollingsworth St
- 14 Mount Pleasant Place
- 12 Chestnut Ave
- 344 Essex St
- 380 Essex St
- 106 Goodridge St
- 440 Essex St
- 42 Joyce St Unit H
- 14 Jewetts Ct
- 44 Eutaw Ave
- 249 Chatham St
- 248 Essex St
- 69 Hawthorne St
- 0 High St
- 6A Goodridge St
- 27-29 Graves Ave
- 325 Western Ave
- 30 Clifton Ave