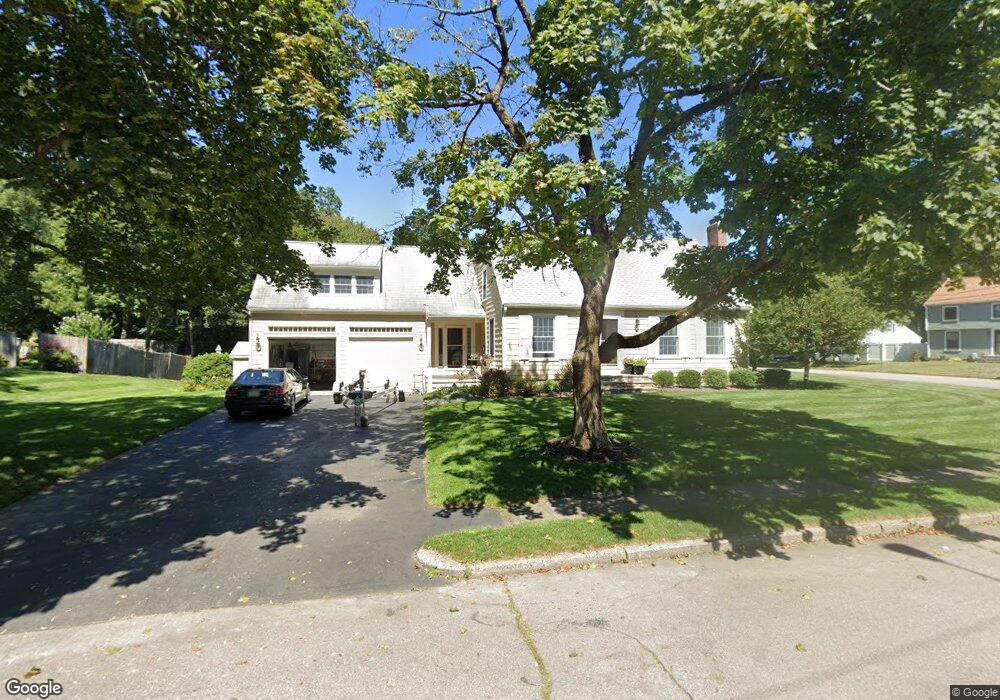
46 Alta Rd East Weymouth, MA 02189
East Weymouth NeighborhoodEstimated Value: $771,000 - $817,000
3
Beds
3
Baths
2,523
Sq Ft
$310/Sq Ft
Est. Value
About This Home
This home is located at 46 Alta Rd, East Weymouth, MA 02189 and is currently estimated at $783,208, approximately $310 per square foot. 46 Alta Rd is a home located in Norfolk County with nearby schools including Abigail Adams Middle School, Weymouth Middle School Chapman, and Weymouth High School.
Ownership History
Date
Name
Owned For
Owner Type
Purchase Details
Closed on
May 2, 1990
Sold by
Alberetti Joseph D
Bought by
Conway Stephen J
Current Estimated Value
Purchase Details
Closed on
Apr 18, 1990
Sold by
Alberetti Joseph
Bought by
Alberetti Joseph D
Create a Home Valuation Report for This Property
The Home Valuation Report is an in-depth analysis detailing your home's value as well as a comparison with similar homes in the area
Home Values in the Area
Average Home Value in this Area
Purchase History
| Date | Buyer | Sale Price | Title Company |
|---|---|---|---|
| Alberetti Joseph D | $8,500 | -- | |
| Conway Stephen J | $150,000 | -- |
Source: Public Records
Mortgage History
| Date | Status | Borrower | Loan Amount |
|---|---|---|---|
| Closed | Alberetti Joseph D | $50,000 | |
| Closed | Alberetti Joseph D | $25,000 | |
| Open | Alberetti Joseph D | $115,000 |
Source: Public Records
Tax History Compared to Growth
Tax History
| Year | Tax Paid | Tax Assessment Tax Assessment Total Assessment is a certain percentage of the fair market value that is determined by local assessors to be the total taxable value of land and additions on the property. | Land | Improvement |
|---|---|---|---|---|
| 2025 | $6,581 | $651,600 | $212,200 | $439,400 |
| 2024 | $6,582 | $640,900 | $222,300 | $418,600 |
| 2023 | $6,344 | $607,100 | $205,800 | $401,300 |
| 2022 | $6,155 | $537,100 | $190,600 | $346,500 |
| 2021 | $5,958 | $507,500 | $190,600 | $316,900 |
| 2020 | $5,753 | $482,600 | $190,600 | $292,000 |
| 2019 | $5,662 | $467,200 | $183,300 | $283,900 |
| 2018 | $5,473 | $437,800 | $174,500 | $263,300 |
| 2017 | $5,247 | $409,600 | $151,100 | $258,500 |
| 2016 | $5,042 | $393,900 | $145,300 | $248,600 |
| 2015 | $4,790 | $371,300 | $145,300 | $226,000 |
| 2014 | $4,467 | $335,900 | $135,200 | $200,700 |
Source: Public Records
Map
Nearby Homes
- 38 School St Unit 2
- 1297 Pleasant St
- 17 Grove St
- 124 Charles Diersch St
- 10 Duck Ln
- 249 High St
- 9 Cranberry Ln
- 86 Black Rock Dr
- 2 Black Rock Dr Unit 21
- 2 Black Rock Dr
- 955 Pleasant St Unit 11
- 14 Old Stone Way Unit 11
- 575 Broad St Unit 305
- 575 Broad St Unit 215
- 56 Putnam St
- 10 Chapman St Unit 205
- 10 Chapman St Unit 202
- 131 Mutton Ln
- 209 Lake St Unit 69
- 16 Oak Cliff Rd