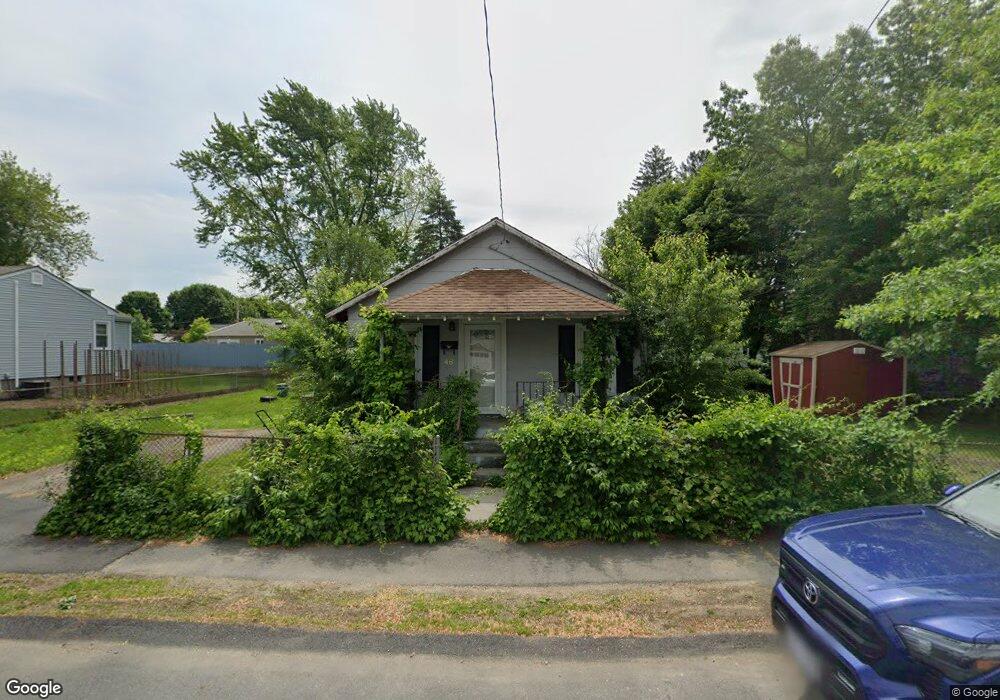
46 Ardmore Rd Dedham, MA 02026
The Manor NeighborhoodEstimated Value: $445,000 - $557,510
2
Beds
1
Bath
871
Sq Ft
$576/Sq Ft
Est. Value
About This Home
This home is located at 46 Ardmore Rd, Dedham, MA 02026 and is currently estimated at $501,628, approximately $575 per square foot. 46 Ardmore Rd is a home located in Norfolk County with nearby schools including Greenlodge Elementary School, Dedham Middle School, and Dedham High School.
Ownership History
Date
Name
Owned For
Owner Type
Purchase Details
Closed on
Jul 20, 2001
Sold by
Moran Patricia F
Bought by
Moran Kevin J
Current Estimated Value
Home Financials for this Owner
Home Financials are based on the most recent Mortgage that was taken out on this home.
Original Mortgage
$60,000
Outstanding Balance
$23,223
Interest Rate
7.2%
Mortgage Type
Purchase Money Mortgage
Estimated Equity
$478,405
Create a Home Valuation Report for This Property
The Home Valuation Report is an in-depth analysis detailing your home's value as well as a comparison with similar homes in the area
Home Values in the Area
Average Home Value in this Area
Purchase History
| Date | Buyer | Sale Price | Title Company |
|---|---|---|---|
| Moran Kevin J | $161,500 | -- |
Source: Public Records
Mortgage History
| Date | Status | Borrower | Loan Amount |
|---|---|---|---|
| Open | Moran Kevin J | $60,000 |
Source: Public Records
Tax History Compared to Growth
Tax History
| Year | Tax Paid | Tax Assessment Tax Assessment Total Assessment is a certain percentage of the fair market value that is determined by local assessors to be the total taxable value of land and additions on the property. | Land | Improvement |
|---|---|---|---|---|
| 2025 | $6,109 | $484,100 | $344,500 | $139,600 |
| 2024 | $5,583 | $446,600 | $312,500 | $134,100 |
| 2023 | $5,157 | $401,600 | $283,000 | $118,600 |
| 2022 | $4,925 | $368,900 | $265,800 | $103,100 |
| 2021 | $4,594 | $336,100 | $246,100 | $90,000 |
| 2020 | $4,858 | $354,100 | $246,100 | $108,000 |
| 2019 | $4,314 | $304,900 | $214,000 | $90,900 |
| 2018 | $4,030 | $277,000 | $187,000 | $90,000 |
| 2017 | $3,911 | $265,000 | $175,000 | $90,000 |
| 2016 | $3,862 | $249,300 | $162,000 | $87,300 |
| 2015 | $4,260 | $268,400 | $161,700 | $106,700 |
| 2014 | $4,091 | $254,400 | $158,800 | $95,600 |
Source: Public Records
Map
Nearby Homes