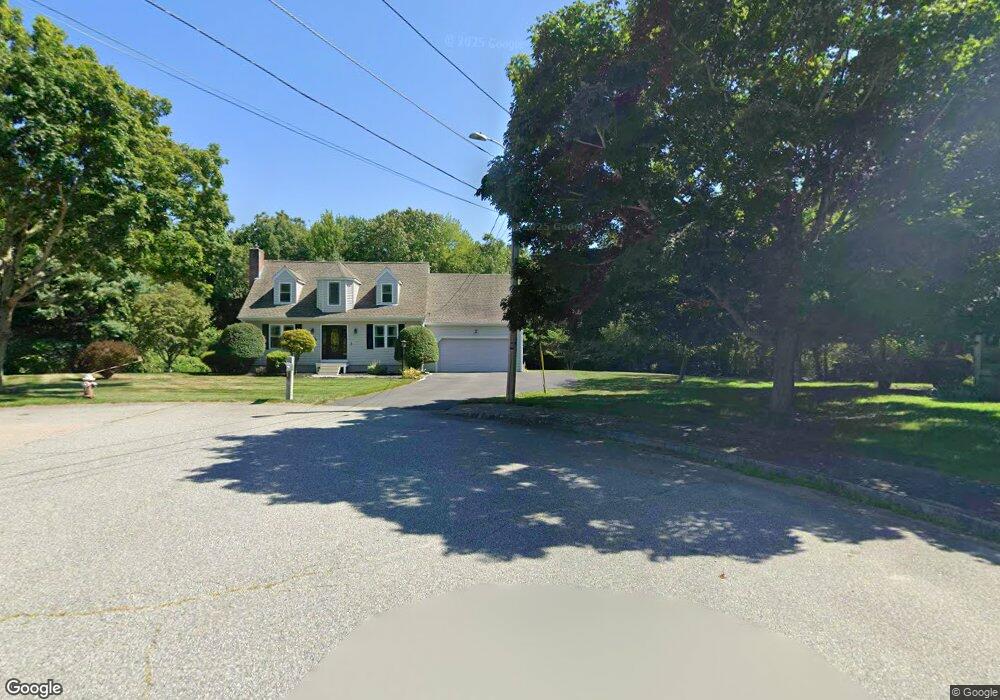
46 Atlantic Rd North Attleboro, MA 02760
North Attleboro NeighborhoodEstimated Value: $625,000 - $684,000
3
Beds
2
Baths
1,396
Sq Ft
$468/Sq Ft
Est. Value
About This Home
This home is located at 46 Atlantic Rd, North Attleboro, MA 02760 and is currently estimated at $653,360, approximately $468 per square foot. 46 Atlantic Rd is a home located in Bristol County with nearby schools including North Attleboro High School, Cadence Academy Preschool - North Attleborough, and St John The Evangelist School.
Ownership History
Date
Name
Owned For
Owner Type
Purchase Details
Closed on
Aug 23, 2006
Sold by
Lombard Donna M and Lombard Robert L
Bought by
Davis Jessica L and Davis Wayne E
Current Estimated Value
Purchase Details
Closed on
Feb 25, 1994
Sold by
Fisher Stephen B and Fisher Marie D
Bought by
Lombard Robert L and Lombard Donna M
Create a Home Valuation Report for This Property
The Home Valuation Report is an in-depth analysis detailing your home's value as well as a comparison with similar homes in the area
Home Values in the Area
Average Home Value in this Area
Purchase History
| Date | Buyer | Sale Price | Title Company |
|---|---|---|---|
| Davis Jessica L | $399,900 | -- | |
| Lombard Robert L | $165,000 | -- |
Source: Public Records
Mortgage History
| Date | Status | Borrower | Loan Amount |
|---|---|---|---|
| Open | Lombard Robert L | $26,000 | |
| Open | Lombard Robert L | $280,000 | |
| Closed | Lombard Robert L | $33,000 | |
| Closed | Lombard Robert L | $290,000 |
Source: Public Records
Tax History Compared to Growth
Tax History
| Year | Tax Paid | Tax Assessment Tax Assessment Total Assessment is a certain percentage of the fair market value that is determined by local assessors to be the total taxable value of land and additions on the property. | Land | Improvement |
|---|---|---|---|---|
| 2025 | $6,659 | $564,800 | $168,800 | $396,000 |
| 2024 | $6,330 | $548,500 | $168,800 | $379,700 |
| 2023 | $6,332 | $495,100 | $168,800 | $326,300 |
| 2022 | $5,933 | $425,900 | $168,800 | $257,100 |
| 2021 | $5,671 | $397,400 | $168,800 | $228,600 |
| 2020 | $5,539 | $386,000 | $168,800 | $217,200 |
| 2019 | $5,354 | $376,000 | $153,800 | $222,200 |
| 2018 | $4,785 | $358,700 | $153,800 | $204,900 |
| 2017 | $4,462 | $337,500 | $153,800 | $183,700 |
| 2016 | $4,533 | $342,900 | $170,800 | $172,100 |
| 2015 | $4,184 | $318,400 | $170,800 | $147,600 |
| 2014 | $3,891 | $293,900 | $150,100 | $143,800 |
Source: Public Records
Map
Nearby Homes