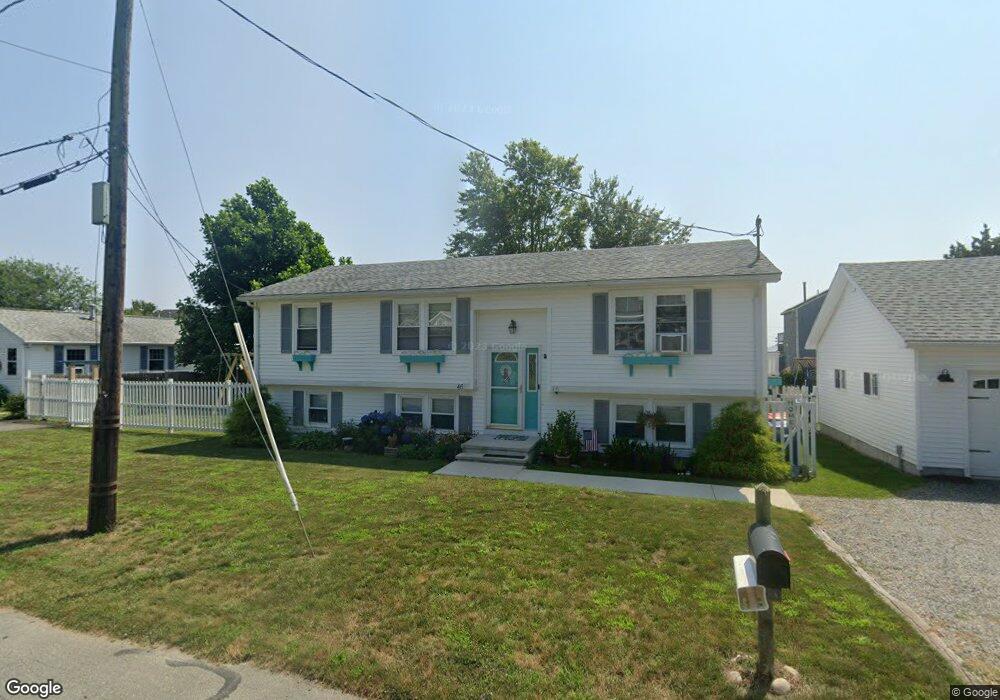
46 Bay St Fairhaven, MA 02719
Pope Beach NeighborhoodEstimated Value: $538,830 - $660,000
3
Beds
2
Baths
1,104
Sq Ft
$529/Sq Ft
Est. Value
About This Home
This home is located at 46 Bay St, Fairhaven, MA 02719 and is currently estimated at $584,208, approximately $529 per square foot. 46 Bay St is a home located in Bristol County with nearby schools including Fairhaven High School, City On A Hill Charter Public School New Bedford, and St. Joseph School.
Ownership History
Date
Name
Owned For
Owner Type
Purchase Details
Closed on
Apr 26, 2010
Sold by
Hunt Raymond D and Hunt Denise P
Bought by
Hunt Denise P
Current Estimated Value
Purchase Details
Closed on
May 28, 2002
Sold by
Carreiro Joseph and Carreiro Cynthia A
Bought by
Hunt Raymond D and Hunt Denise P
Home Financials for this Owner
Home Financials are based on the most recent Mortgage that was taken out on this home.
Original Mortgage
$144,000
Interest Rate
7.01%
Mortgage Type
Purchase Money Mortgage
Purchase Details
Closed on
Jul 30, 1999
Sold by
Lawson Florence
Bought by
Carreiro Joseph and Carreiro Cynthia A
Purchase Details
Closed on
Apr 16, 1999
Sold by
Pike Michael J and Pike Barbara J
Bought by
Lawson Florence
Purchase Details
Closed on
Jul 23, 1993
Sold by
Coury Ernest A
Bought by
Pike Michael J and Shanka Barbara J
Purchase Details
Closed on
Aug 25, 1989
Sold by
Lawson Florence
Bought by
Coury Ernst A
Create a Home Valuation Report for This Property
The Home Valuation Report is an in-depth analysis detailing your home's value as well as a comparison with similar homes in the area
Home Values in the Area
Average Home Value in this Area
Purchase History
| Date | Buyer | Sale Price | Title Company |
|---|---|---|---|
| Hunt Denise P | -- | -- | |
| Hunt Raymond D | $180,000 | -- | |
| Carreiro Joseph | $137,000 | -- | |
| Lawson Florence | $122,000 | -- | |
| Pike Michael J | $115,000 | -- | |
| Coury Ernst A | $140,000 | -- |
Source: Public Records
Mortgage History
| Date | Status | Borrower | Loan Amount |
|---|---|---|---|
| Previous Owner | Coury Ernst A | $152,500 | |
| Previous Owner | Coury Ernst A | $144,000 |
Source: Public Records
Tax History
| Year | Tax Paid | Tax Assessment Tax Assessment Total Assessment is a certain percentage of the fair market value that is determined by local assessors to be the total taxable value of land and additions on the property. | Land | Improvement |
|---|---|---|---|---|
| 2025 | $40 | $432,600 | $190,100 | $242,500 |
| 2024 | $3,963 | $429,400 | $190,100 | $239,300 |
| 2023 | $3,901 | $392,100 | $176,200 | $215,900 |
| 2022 | $3,884 | $380,000 | $167,900 | $212,100 |
| 2021 | $3,917 | $346,900 | $152,600 | $194,300 |
| 2020 | $3,728 | $337,100 | $145,700 | $191,400 |
| 2019 | $3,515 | $301,200 | $132,600 | $168,600 |
| 2018 | $3,352 | $285,300 | $126,300 | $159,000 |
| 2017 | $3,409 | $283,100 | $126,300 | $156,800 |
| 2016 | $3,256 | $267,300 | $126,300 | $141,000 |
| 2015 | $3,210 | $264,200 | $126,300 | $137,900 |
Source: Public Records
Map
Nearby Homes
- 15 Bayview Ave
- 27 Bayview Ave
- 58 Bayview Ave
- 3.5 Golf St
- 190 Sconticut Neck Rd
- 00 Copeland St
- 8 Manor Dr
- 5 Reservation Rd
- 2 Washburn Ave
- 00 Huttleston Ave
- 11 Lawton St
- 181 Washington St
- 33 Narragansett Blvd
- 32 Cedar St
- 32 Green St
- 145 Pleasant St
- 77 Adams St
- 58 Washington St
- 39 Christian St
- 0 Nulands Neck Unit 73286360
Your Personal Tour Guide
Ask me questions while you tour the home.