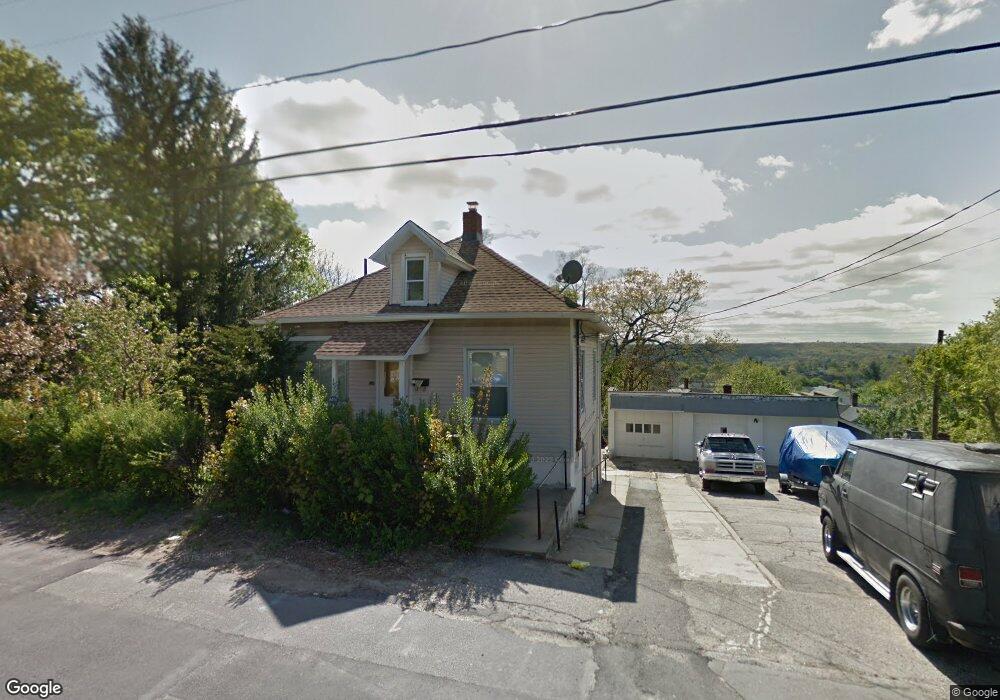
46 Birch St Waterbury, CT 06704
North End District NeighborhoodEstimated Value: $219,000 - $265,000
3
Beds
2
Baths
774
Sq Ft
$314/Sq Ft
Est. Value
About This Home
This home is located at 46 Birch St, Waterbury, CT 06704 and is currently estimated at $243,032, approximately $313 per square foot. 46 Birch St is a home located in New Haven County with nearby schools including Woodrow Wilson School, Michael F. Wallace Middle School, and Crosby High School.
Ownership History
Date
Name
Owned For
Owner Type
Purchase Details
Closed on
Aug 28, 2015
Sold by
Fnma
Bought by
O & A Properties Llc
Current Estimated Value
Purchase Details
Closed on
Mar 3, 2015
Sold by
Porter Jacquelinwe and Liberty Home Equity So
Bought by
Liberty Home Equity So
Purchase Details
Closed on
Sep 17, 1993
Sold by
Wilson Barry Forrest
Bought by
Porter Curtis and Porter Earsie
Home Financials for this Owner
Home Financials are based on the most recent Mortgage that was taken out on this home.
Original Mortgage
$62,900
Interest Rate
7.16%
Mortgage Type
Purchase Money Mortgage
Create a Home Valuation Report for This Property
The Home Valuation Report is an in-depth analysis detailing your home's value as well as a comparison with similar homes in the area
Home Values in the Area
Average Home Value in this Area
Purchase History
| Date | Buyer | Sale Price | Title Company |
|---|---|---|---|
| O & A Properties Llc | $35,000 | -- | |
| Fnma | -- | -- | |
| Liberty Home Equity So | $42,000 | -- | |
| Porter Curtis | $63,000 | -- |
Source: Public Records
Mortgage History
| Date | Status | Borrower | Loan Amount |
|---|---|---|---|
| Previous Owner | Porter Curtis | $172,500 | |
| Previous Owner | Porter Curtis | $62,900 |
Source: Public Records
Tax History Compared to Growth
Tax History
| Year | Tax Paid | Tax Assessment Tax Assessment Total Assessment is a certain percentage of the fair market value that is determined by local assessors to be the total taxable value of land and additions on the property. | Land | Improvement |
|---|---|---|---|---|
| 2025 | $4,049 | $90,020 | $14,000 | $76,020 |
| 2024 | $4,451 | $90,020 | $14,000 | $76,020 |
| 2023 | $4,878 | $90,020 | $14,000 | $76,020 |
| 2022 | $2,469 | $41,000 | $14,000 | $27,000 |
| 2021 | $2,469 | $41,000 | $14,000 | $27,000 |
| 2020 | $2,469 | $41,000 | $14,000 | $27,000 |
| 2019 | $2,469 | $41,000 | $14,000 | $27,000 |
| 2018 | $2,469 | $41,000 | $14,000 | $27,000 |
| 2017 | $2,501 | $41,540 | $14,000 | $27,540 |
| 2016 | $2,501 | $41,540 | $14,000 | $27,540 |
| 2015 | $2,905 | $49,900 | $14,000 | $35,900 |
| 2014 | $2,905 | $49,900 | $14,000 | $35,900 |
Source: Public Records
Map
Nearby Homes