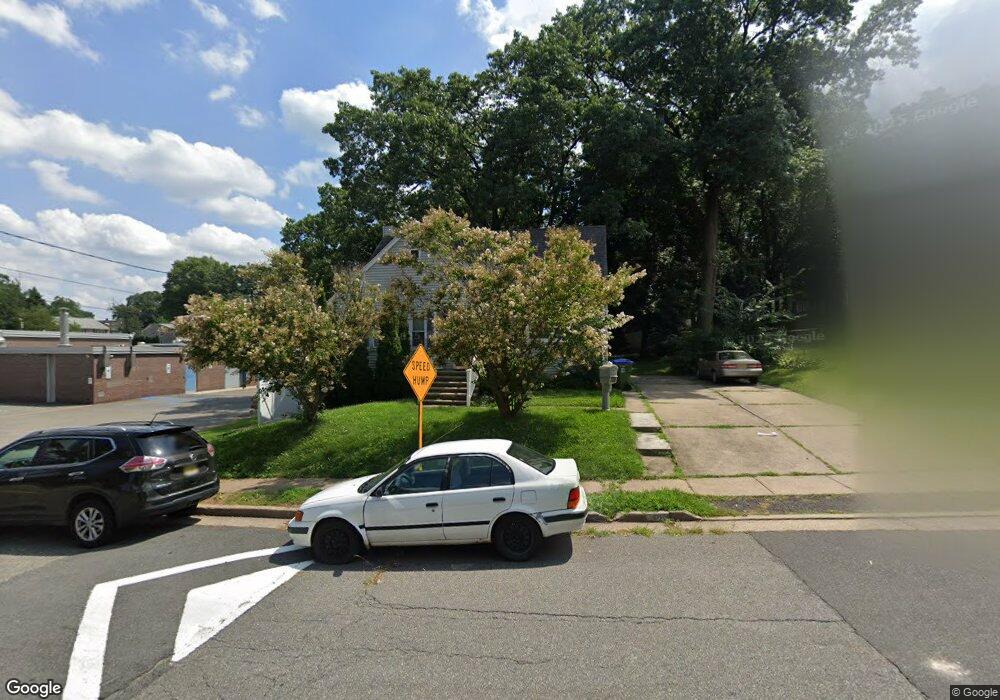
46 Blossom St Edison, NJ 08817
Estimated Value: $562,033 - $654,000
2
Beds
1
Bath
1,443
Sq Ft
$422/Sq Ft
Est. Value
About This Home
This home is located at 46 Blossom St, Edison, NJ 08817 and is currently estimated at $609,508, approximately $422 per square foot. 46 Blossom St is a home located in Middlesex County with nearby schools including Lindeneau Elementary School, Thomas Jefferson Middle School, and Edison High School.
Ownership History
Date
Name
Owned For
Owner Type
Purchase Details
Closed on
Aug 6, 2014
Sold by
Pham Victoria and Pham Thach
Bought by
Patel Prit N
Current Estimated Value
Home Financials for this Owner
Home Financials are based on the most recent Mortgage that was taken out on this home.
Original Mortgage
$304,029
Outstanding Balance
$231,685
Interest Rate
4.25%
Mortgage Type
FHA
Estimated Equity
$377,823
Purchase Details
Closed on
Aug 4, 2005
Sold by
Leon Nelson
Bought by
Pham Victoria and Pham Thach
Home Financials for this Owner
Home Financials are based on the most recent Mortgage that was taken out on this home.
Original Mortgage
$364,720
Interest Rate
5.68%
Purchase Details
Closed on
Apr 18, 2000
Sold by
Chiovaro Michael
Bought by
Leon Nelson and Jimenez Maria
Home Financials for this Owner
Home Financials are based on the most recent Mortgage that was taken out on this home.
Original Mortgage
$193,700
Interest Rate
8.23%
Create a Home Valuation Report for This Property
The Home Valuation Report is an in-depth analysis detailing your home's value as well as a comparison with similar homes in the area
Home Values in the Area
Average Home Value in this Area
Purchase History
| Date | Buyer | Sale Price | Title Company |
|---|---|---|---|
| Patel Prit N | $332,000 | None Available | |
| Pham Victoria | $455,900 | -- | |
| Leon Nelson | $203,900 | -- |
Source: Public Records
Mortgage History
| Date | Status | Borrower | Loan Amount |
|---|---|---|---|
| Open | Patel Prit N | $304,029 | |
| Previous Owner | Pham Victoria | $364,720 | |
| Previous Owner | Leon Nelson | $193,700 |
Source: Public Records
Tax History Compared to Growth
Tax History
| Year | Tax Paid | Tax Assessment Tax Assessment Total Assessment is a certain percentage of the fair market value that is determined by local assessors to be the total taxable value of land and additions on the property. | Land | Improvement |
|---|---|---|---|---|
| 2025 | $9,215 | $154,800 | $87,500 | $67,300 |
| 2024 | $9,166 | $154,800 | $87,500 | $67,300 |
| 2023 | $9,166 | $154,800 | $87,500 | $67,300 |
| 2022 | $9,169 | $154,800 | $87,500 | $67,300 |
| 2021 | $9,138 | $154,800 | $87,500 | $67,300 |
| 2020 | $9,054 | $154,800 | $87,500 | $67,300 |
| 2019 | $8,712 | $154,800 | $87,500 | $67,300 |
| 2018 | $8,502 | $154,800 | $87,500 | $67,300 |
| 2017 | $8,322 | $154,800 | $87,500 | $67,300 |
| 2016 | $8,167 | $154,800 | $87,500 | $67,300 |
| 2015 | $7,855 | $154,800 | $87,500 | $67,300 |
| 2014 | $7,625 | $154,800 | $87,500 | $67,300 |
Source: Public Records
Map
Nearby Homes