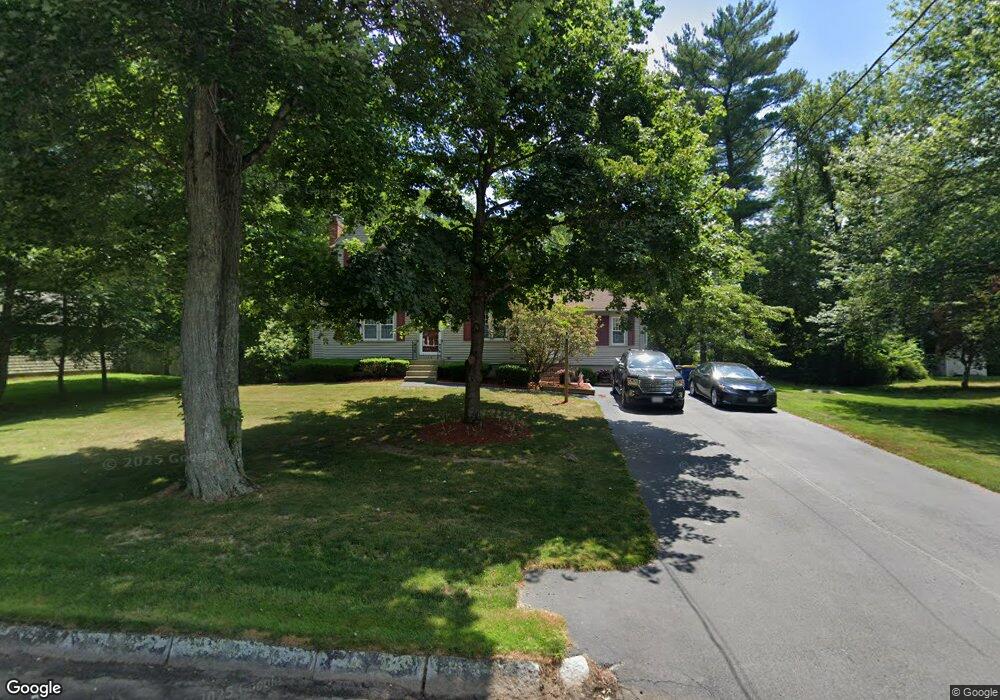
46 Branch Rd East Bridgewater, MA 02333
Estimated Value: $601,000 - $673,000
4
Beds
2
Baths
1,760
Sq Ft
$358/Sq Ft
Est. Value
About This Home
This home is located at 46 Branch Rd, East Bridgewater, MA 02333 and is currently estimated at $630,686, approximately $358 per square foot. 46 Branch Rd is a home located in Plymouth County with nearby schools including Central Elementary School, Gordon W Mitchell Middle School, and East Bridgewater Jr./Sr. High School.
Ownership History
Date
Name
Owned For
Owner Type
Purchase Details
Closed on
Dec 8, 2015
Sold by
Kenney James J and Kenney Ada M
Bought by
Ada M Kenney Ret
Current Estimated Value
Purchase Details
Closed on
Nov 18, 1977
Bought by
Ada M Kenney Ret and Kenney, Ada M
Create a Home Valuation Report for This Property
The Home Valuation Report is an in-depth analysis detailing your home's value as well as a comparison with similar homes in the area
Home Values in the Area
Average Home Value in this Area
Purchase History
| Date | Buyer | Sale Price | Title Company |
|---|---|---|---|
| Ada M Kenney Ret | -- | -- | |
| Ada M Kenney Ret | -- | -- |
Source: Public Records
Mortgage History
| Date | Status | Borrower | Loan Amount |
|---|---|---|---|
| Previous Owner | Ada M Kenney Ret | $75,000 | |
| Previous Owner | Ada M Kenney Ret | $90,000 | |
| Previous Owner | Ada M Kenney Ret | $80,000 | |
| Previous Owner | Ada M Kenney Ret | $15,000 |
Source: Public Records
Tax History Compared to Growth
Tax History
| Year | Tax Paid | Tax Assessment Tax Assessment Total Assessment is a certain percentage of the fair market value that is determined by local assessors to be the total taxable value of land and additions on the property. | Land | Improvement |
|---|---|---|---|---|
| 2025 | $7,376 | $539,600 | $212,400 | $327,200 |
| 2024 | $7,184 | $519,100 | $204,300 | $314,800 |
| 2023 | $7,101 | $491,400 | $204,300 | $287,100 |
| 2022 | $6,494 | $416,300 | $170,300 | $246,000 |
| 2021 | $5,512 | $373,400 | $163,700 | $209,700 |
| 2020 | $6,090 | $355,600 | $157,400 | $198,200 |
| 2019 | $5,958 | $339,300 | $150,400 | $188,900 |
| 2018 | $5,783 | $322,000 | $150,400 | $171,600 |
| 2017 | $7,131 | $307,000 | $143,400 | $163,600 |
| 2016 | $5,423 | $298,600 | $143,400 | $155,200 |
| 2015 | $5,264 | $296,400 | $142,400 | $154,000 |
| 2014 | $5,022 | $289,100 | $139,500 | $149,600 |
Source: Public Records
Map
Nearby Homes
- 1247 Central St
- 936 Central St
- 5 Della Way
- 844 Washington St
- 9 Daisy Ln
- 1 Simmons Place
- 182 Crystal Water Dr Unit 182
- 217 Crystal Water Dr
- 170 Elm St
- 28 Brookbend Way E
- 78 Crystal Water Dr
- 51 Stonegate Dr
- 1993 Washington St
- 71 Stonegate Dr
- 587 Bridge St
- 2045 Washington St
- 26 Meadowbrook Dr
- 14 Mountain Ash Rd
- 94 Pond St
- 22 Hudson St