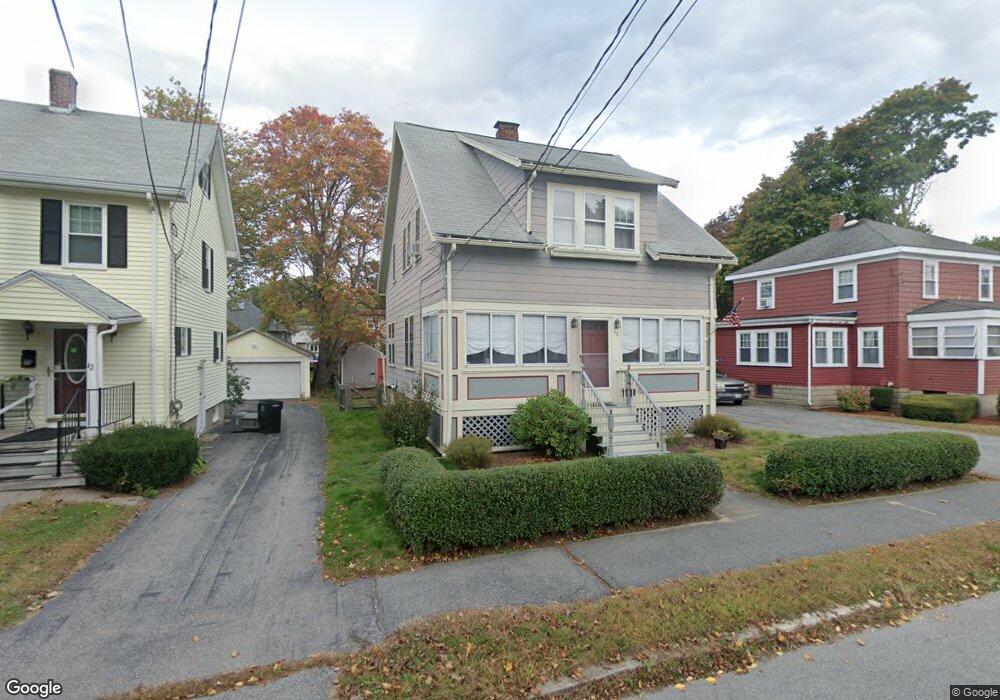
46 Burdette Ave Framingham, MA 01702
Estimated Value: $553,000 - $572,131
3
Beds
2
Baths
1,296
Sq Ft
$434/Sq Ft
Est. Value
About This Home
This home is located at 46 Burdette Ave, Framingham, MA 01702 and is currently estimated at $562,033, approximately $433 per square foot. 46 Burdette Ave is a home located in Middlesex County with nearby schools including Framingham High School, Christa McAuliffe Charter School, and Happy Hollow School.
Ownership History
Date
Name
Owned For
Owner Type
Purchase Details
Closed on
Dec 10, 2007
Sold by
Hansen Jared R and Hansen Marjorie
Bought by
Bradford R Margaret
Current Estimated Value
Home Financials for this Owner
Home Financials are based on the most recent Mortgage that was taken out on this home.
Original Mortgage
$210,000
Interest Rate
6.37%
Mortgage Type
Purchase Money Mortgage
Purchase Details
Closed on
Aug 25, 2000
Sold by
Barlow Nancy B and Barlow James C
Bought by
Hansen Jared R and Hansen Marjorie
Purchase Details
Closed on
Mar 12, 1998
Sold by
Lieberman Daniel and Lieberman Lynn
Bought by
Reese Nancy B and Barlow James C
Purchase Details
Closed on
Apr 19, 1996
Sold by
Chassagnade Francois J and Chassagnade Patrice
Bought by
Lieberman Daniel and Lieberman Lynn
Purchase Details
Closed on
Feb 18, 1992
Sold by
Weixel Frederick and Weixel Suzanne
Bought by
Chassagnade Francois J and Chassagnade Patrice
Create a Home Valuation Report for This Property
The Home Valuation Report is an in-depth analysis detailing your home's value as well as a comparison with similar homes in the area
Home Values in the Area
Average Home Value in this Area
Purchase History
| Date | Buyer | Sale Price | Title Company |
|---|---|---|---|
| Bradford R Margaret | $290,000 | -- | |
| Reese Nancy B | $158,070 | -- | |
| Lieberman Daniel | $151,000 | -- | |
| Lieberman Daniel | $151,000 | -- | |
| Chassagnade Francois J | $140,700 | -- | |
| Bradford R Margaret | $290,000 | -- | |
| Hansen Jared R | $207,900 | -- | |
| Reese Nancy B | $158,070 | -- | |
| Lieberman Daniel | $151,000 | -- | |
| Chassagnade Francois J | $140,700 | -- |
Source: Public Records
Mortgage History
| Date | Status | Borrower | Loan Amount |
|---|---|---|---|
| Open | Chassagnade Francois J | $211,000 | |
| Closed | Bradford R Margaret | $210,000 |
Source: Public Records
Tax History
| Year | Tax Paid | Tax Assessment Tax Assessment Total Assessment is a certain percentage of the fair market value that is determined by local assessors to be the total taxable value of land and additions on the property. | Land | Improvement |
|---|---|---|---|---|
| 2025 | $5,384 | $450,900 | $215,400 | $235,500 |
| 2024 | $5,223 | $419,200 | $193,000 | $226,200 |
| 2023 | $4,982 | $380,600 | $173,000 | $207,600 |
| 2022 | $4,659 | $339,100 | $157,100 | $182,000 |
| 2021 | $4,535 | $322,800 | $151,000 | $171,800 |
| 2020 | $4,437 | $296,200 | $131,300 | $164,900 |
| 2019 | $4,305 | $279,900 | $127,500 | $152,400 |
| 2018 | $4,215 | $258,300 | $120,700 | $137,600 |
| 2017 | $4,193 | $250,900 | $117,300 | $133,600 |
| 2016 | $3,975 | $228,700 | $113,500 | $115,200 |
| 2015 | $3,769 | $211,500 | $111,400 | $100,100 |
Source: Public Records
Map
Nearby Homes
- 96 Mansfield St
- 47 Bishop Dr
- 132 Howe St Unit B
- 16 Grant Street Extension
- 56 Morency St Unit D
- 15 Willis St Unit 4
- 17 Brigham Rd
- 10 Nolin St
- 18 Beaver Ct
- 126 Beaver St Unit 56
- 126 Beaver St Unit 5
- 120 Franklin St
- 3 Oxbow Rd
- 50 Kittredge Rd
- 11 Village Rock Ln Unit 21
- 23 Village Rock Ln Unit 22
- 21 Village Rock Ln Unit 4
- 9 Village Hill Ln Unit 15
- 5 Village Rock Ln Unit 24
- 4 Village Rock Ln Unit 9
- 42 Burdette Ave
- 50 Burdette Ave
- 38 Burdette Ave
- 38 Burdette Ave
- 45 Essex St
- 41 Essex St
- 268 Grant St
- 264 Grant St Unit 1
- 264 Grant St
- 264 Grant St Unit 264
- 37 Essex St
- 270 Grant St
- 266 Grant St Unit 1
- 266 Grant St Unit 2
- 266 Grant St
- 266 Grant St Unit 266
- 49 Burdette Ave
- 254 Grant St
- 43 Burdette Ave
- 33 Essex St
Your Personal Tour Guide
Ask me questions while you tour the home.