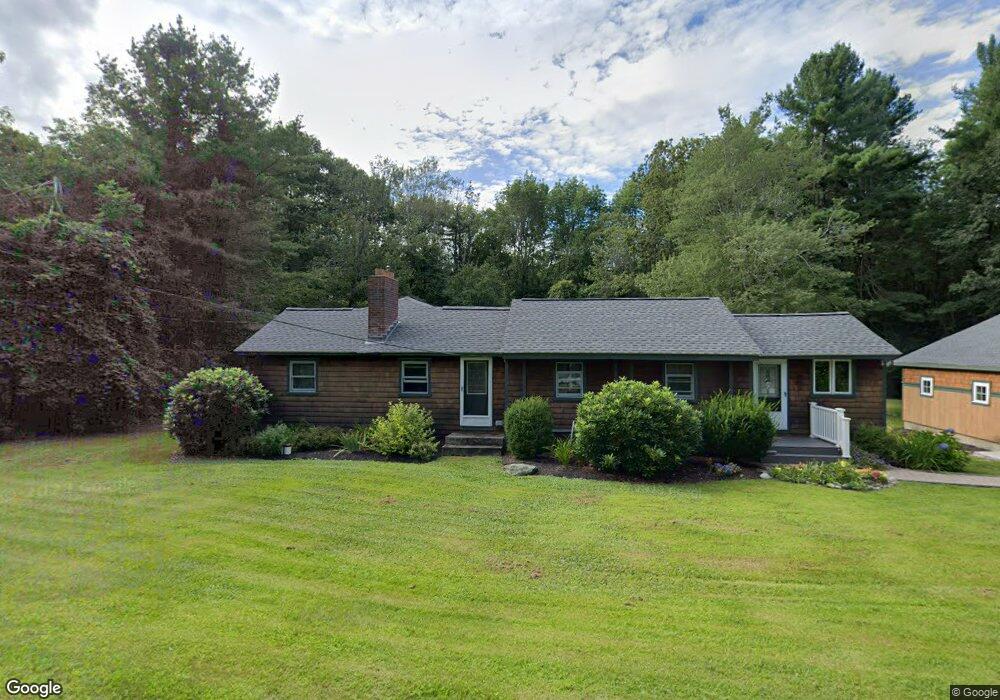
46 Calamint Hill Rd S Princeton, MA 01541
Estimated Value: $496,245 - $565,000
4
Beds
2
Baths
1,672
Sq Ft
$318/Sq Ft
Est. Value
About This Home
This home is located at 46 Calamint Hill Rd S, Princeton, MA 01541 and is currently estimated at $531,811, approximately $318 per square foot. 46 Calamint Hill Rd S is a home located in Worcester County with nearby schools including Wachusett Regional High School.
Ownership History
Date
Name
Owned For
Owner Type
Purchase Details
Closed on
Jun 14, 2007
Sold by
Burns Jeanine and Burns Sean
Bought by
Locke Jeffrey C and Locke Katherine A
Current Estimated Value
Home Financials for this Owner
Home Financials are based on the most recent Mortgage that was taken out on this home.
Original Mortgage
$251,750
Outstanding Balance
$154,044
Interest Rate
6.19%
Mortgage Type
Purchase Money Mortgage
Estimated Equity
$377,767
Purchase Details
Closed on
Aug 2, 2004
Sold by
Allard Ft and Kunst Kerry
Bought by
Burns Jeanine and Burns Sean
Home Financials for this Owner
Home Financials are based on the most recent Mortgage that was taken out on this home.
Original Mortgage
$216,000
Interest Rate
6.33%
Mortgage Type
Purchase Money Mortgage
Purchase Details
Closed on
Aug 1, 2003
Sold by
Allard Laura A and Allard Paul M
Bought by
Allard Ft and Rice Robert J
Create a Home Valuation Report for This Property
The Home Valuation Report is an in-depth analysis detailing your home's value as well as a comparison with similar homes in the area
Home Values in the Area
Average Home Value in this Area
Purchase History
| Date | Buyer | Sale Price | Title Company |
|---|---|---|---|
| Locke Jeffrey C | $265,000 | -- | |
| Burns Jeanine | $270,000 | -- | |
| Allard Ft | $231,000 | -- |
Source: Public Records
Mortgage History
| Date | Status | Borrower | Loan Amount |
|---|---|---|---|
| Open | Locke Jeffrey C | $251,750 | |
| Previous Owner | Burns Jeanine | $216,000 |
Source: Public Records
Tax History Compared to Growth
Tax History
| Year | Tax Paid | Tax Assessment Tax Assessment Total Assessment is a certain percentage of the fair market value that is determined by local assessors to be the total taxable value of land and additions on the property. | Land | Improvement |
|---|---|---|---|---|
| 2025 | $5,723 | $393,900 | $129,000 | $264,900 |
| 2024 | $5,350 | $381,300 | $129,000 | $252,300 |
| 2023 | $5,255 | $347,100 | $102,900 | $244,200 |
| 2022 | $5,008 | $319,400 | $102,900 | $216,500 |
| 2021 | $4,526 | $280,800 | $102,900 | $177,900 |
| 2020 | $4,394 | $277,200 | $102,900 | $174,300 |
| 2019 | $4,341 | $271,000 | $100,300 | $170,700 |
| 2018 | $4,097 | $237,100 | $91,600 | $145,500 |
| 2017 | $3,771 | $212,100 | $135,900 | $76,200 |
| 2016 | $3,775 | $212,100 | $135,900 | $76,200 |
| 2015 | $3,650 | $211,000 | $133,500 | $77,500 |
Source: Public Records
Map
Nearby Homes
- 166 Ball Hill Rd
- 271 Glenwood Rd
- 81 Glenwood Place
- 147 E County Rd Unit 149
- 139 E County Rd Unit 139
- 15 Stagecoach Rd
- 9 Stagecoach Rd
- 56 Hubbardston Rd
- 175 Glenwood Rd
- 14 Oak Cir
- 101 Brintnal Dr
- 73 Brintnal Dr
- 20 Mountain Rd
- 35 Brintnal Dr
- 45 Old Colony Rd
- 2 Simon Davis Dr
- 58 Merriam Rd
- 28 Merriam Rd
- 11 Mirick Rd
- 134 Mountain Rd
- 48 Calamint Hill Rd S
- 48 Calamint Hill Road Sou
- 50 Calamint Hill Rd S
- 40 Calamint Hill Rd S
- 57 Calamint Hill Rd S
- 27 Calamint Hill Rd S
- 41 School House Rd
- 23 Calamint Hill Rd S
- 63 Calamint Hill Rd S
- 19 Calamint Hill Rd S
- 15 Calamint Hill Rd S
- 72 Calamint Hill Rd S
- 1 Rebecca Rose Pathway
- 157 Ball Hill Rd
- 10 Calamint Hill Rd S
- 9 Calamint Hill Rd S
- 80 Calamint Hill Rd S
- 215 Ball Hill Rd
- 5 Calamint Hill Rd S
- 227 Ball Hill Rd