46 Capen St Windsor, CT 06095
Estimated Value: $367,246 - $485,000
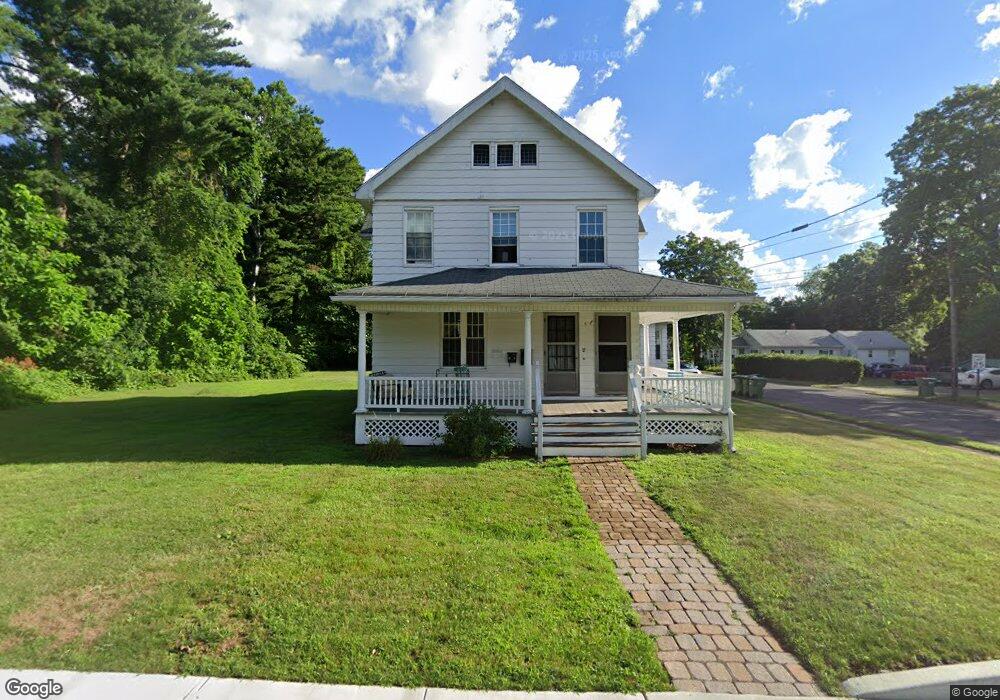
About This Home
This home is located at 46 Capen St, Windsor, CT 06095 and is currently estimated at $402,312, approximately $146 per square foot. 46 Capen St is a home located in Hartford County with nearby schools including Oliver Ellsworth School, John F. Kennedy School, and Sage Park Middle School.
Ownership History
We collect this data history from publicly available records. To have your information removed, we recommend requesting removal directly through your county’s website.
Purchase Details
Purchase Details
Purchase Details
Home Financials for this Owner
Home Financials are based on the most recent Mortgage that was taken out on this home.Home Values in the Area
Average Home Value in this Area
Purchase History
We collect this data history from publicly available records. To have your information removed, we recommend requesting removal directly through your county’s website.
| Date | Buyer | Sale Price | Title Company |
|---|---|---|---|
| -- | None Available | ||
| -- | -- | ||
| $107,000 | -- |
Mortgage History
We collect this data history from publicly available records. To have your information removed, we recommend requesting removal directly through your county’s website.
| Date | Status | Borrower | Loan Amount |
|---|---|---|---|
| Previous Owner | $126,000 | ||
| Previous Owner | $96,300 |
Tax History
We collect this data history from publicly available records. To have your information removed, we recommend requesting removal directly through your county’s website.
| Year | Tax Paid | Tax Assessment Tax Assessment Total Assessment is a certain percentage of the fair market value that is determined by local assessors to be the total taxable value of land and additions on the property. | Land | Improvement |
|---|---|---|---|---|
| 2025 | $6,680 | $224,910 | $64,120 | $160,790 |
| 2024 | $7,157 | $224,910 | $64,120 | $160,790 |
| 2023 | $6,032 | $171,850 | $50,610 | $121,240 |
| 2022 | $5,975 | $171,850 | $50,610 | $121,240 |
| 2021 | $6,018 | $171,850 | $50,610 | $121,240 |
| 2020 | $5,948 | $171,850 | $50,610 | $121,240 |
| 2019 | $5,822 | $171,850 | $50,610 | $121,240 |
| 2018 | $5,213 | $149,100 | $50,610 | $98,490 |
| 2017 | $4,838 | $149,100 | $50,610 | $98,490 |
| 2016 | $4,700 | $149,100 | $50,610 | $98,490 |
| 2015 | $4,610 | $149,100 | $50,610 | $98,490 |
| 2014 | $4,543 | $149,100 | $50,610 | $98,490 |
Map
- 31 Ridgewood Rd
- 44 Welch Ave
- 30 Parkwood Dr
- 66 Maple Ave
- 120 Bloomfield Ave
- 291 Bloomfield Ave
- 10 Scherer Ln
- 342 Capen St
- 318 Capen St
- 33 Mechanic St Unit 203
- 40 Prospect St
- 110 Belmont Ave
- 23 Ludlow Rd
- 24 Valley View Dr
- 167 East St
- 15 Scarborough Rd
- 58 Amanda Cir
- 76 Sinclair St
- 371 Dunfey Ln
- 82 Rood Ave
Ask me questions while you tour the home.