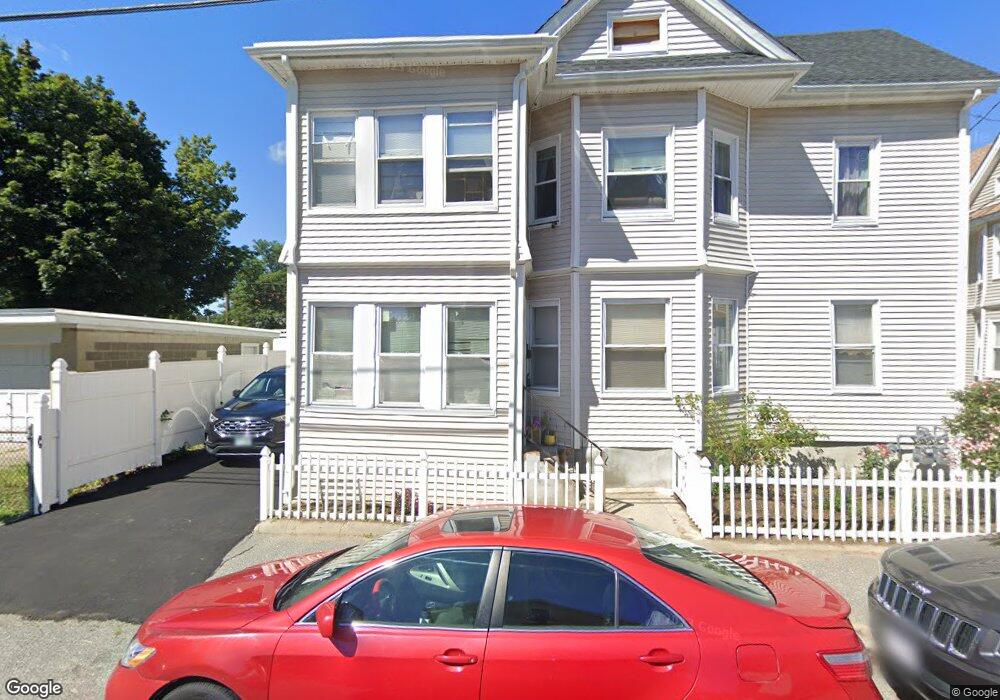
46 Carleton St Methuen, MA 01844
Arlington NeighborhoodEstimated Value: $648,000 - $805,000
4
Beds
4
Baths
2,639
Sq Ft
$267/Sq Ft
Est. Value
About This Home
This home is located at 46 Carleton St, Methuen, MA 01844 and is currently estimated at $705,378, approximately $267 per square foot. 46 Carleton St is a home located in Essex County with nearby schools including Tenney Grammar School, Methuen High School, and Saint Monica School.
Ownership History
Date
Name
Owned For
Owner Type
Purchase Details
Closed on
Oct 26, 2023
Sold by
Balbuena Janet
Bought by
Janet Balbuena T and Janet Balbuena
Current Estimated Value
Purchase Details
Closed on
Jun 14, 2005
Sold by
Alfred Mark A
Bought by
Balbuena Janet
Home Financials for this Owner
Home Financials are based on the most recent Mortgage that was taken out on this home.
Original Mortgage
$217,600
Interest Rate
5.79%
Mortgage Type
Purchase Money Mortgage
Purchase Details
Closed on
Apr 6, 1998
Sold by
Waring John F
Bought by
Alfred Mark A
Home Financials for this Owner
Home Financials are based on the most recent Mortgage that was taken out on this home.
Original Mortgage
$33,000
Interest Rate
6.89%
Mortgage Type
Purchase Money Mortgage
Purchase Details
Closed on
Jul 11, 1989
Sold by
Nomey Grace M
Bought by
333-341 Essex St Rt
Create a Home Valuation Report for This Property
The Home Valuation Report is an in-depth analysis detailing your home's value as well as a comparison with similar homes in the area
Home Values in the Area
Average Home Value in this Area
Purchase History
| Date | Buyer | Sale Price | Title Company |
|---|---|---|---|
| Janet Balbuena T | -- | None Available | |
| Janet Balbuena T | -- | None Available | |
| Janet Balbuena T | -- | None Available | |
| Balbuena Janet | $272,000 | -- | |
| Balbuena Janet | $272,000 | -- | |
| Alfred Mark A | $44,000 | -- | |
| Alfred Mark A | $44,000 | -- | |
| 333-341 Essex St Rt | $185,000 | -- | |
| 333-341 Essex St Rt | $185,000 | -- |
Source: Public Records
Mortgage History
| Date | Status | Borrower | Loan Amount |
|---|---|---|---|
| Previous Owner | Balbuena Janet | $217,600 | |
| Previous Owner | 333-341 Essex St Rt | $33,000 |
Source: Public Records
Tax History
| Year | Tax Paid | Tax Assessment Tax Assessment Total Assessment is a certain percentage of the fair market value that is determined by local assessors to be the total taxable value of land and additions on the property. | Land | Improvement |
|---|---|---|---|---|
| 2025 | $6,970 | $658,800 | $153,100 | $505,700 |
| 2024 | $6,034 | $555,600 | $137,300 | $418,300 |
| 2023 | $5,879 | $502,500 | $121,400 | $381,100 |
| 2022 | $5,292 | $405,500 | $95,000 | $310,500 |
| 2021 | $5,073 | $384,600 | $89,800 | $294,800 |
| 2020 | $4,781 | $355,700 | $84,500 | $271,200 |
| 2019 | $4,053 | $285,600 | $59,400 | $226,200 |
| 2018 | $3,807 | $266,800 | $59,400 | $207,400 |
| 2017 | $3,667 | $250,300 | $55,400 | $194,900 |
| 2016 | $3,347 | $226,000 | $51,500 | $174,500 |
| 2015 | $3,057 | $209,400 | $42,800 | $166,600 |
Source: Public Records
Map
Nearby Homes
- 9-11 Horne St
- 6 Huse Rd
- 29 Center St
- 123 Lawrence St
- 23 Chase St
- 24 Railroad St
- 20-22 Ashland Ave
- 434-438 Hampshire St
- 97 Kenwood Rd
- 27 Willow St Unit A
- 36 Manchester St
- 179-181 West St
- 281 Broadway
- 29-31 Washington St
- 83 Arnold St
- 10 Holly St
- 129-131 Lexington St
- 7-9 Bennington St
- 324-326 Broadway
- 7 Field Ave
- 8 Carleton St Unit 10
- 19 Merrill St
- 13 Merrill St
- 13 Merrill St Unit 19
- 12 Carleton St Unit 14
- 21 Merrill St Unit 23
- 9-11 Carleton St
- 9 Carleton St Unit 11
- 13 Carleton St
- 15 Carleton St
- 16-18 Carleton St
- 16 Carleton St Unit 18
- 25 Merrill St
- 17 Carleton St
- 12 Merrill St
- 12 Merrill St Unit 2
- 14 Merrill St
- 20-22 Carleton St
- 20 Carleton St Unit 22
- 19 Carleton St
Your Personal Tour Guide
Ask me questions while you tour the home.