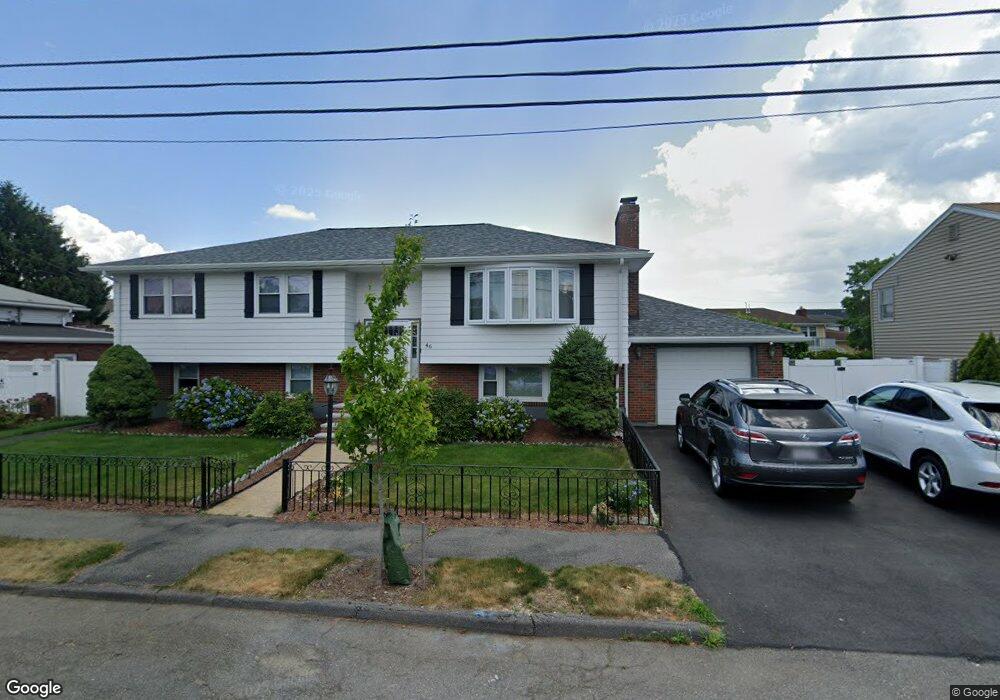
46 Case Dr Revere, MA 02151
West Revere NeighborhoodEstimated Value: $906,000 - $994,000
3
Beds
2
Baths
2,254
Sq Ft
$419/Sq Ft
Est. Value
About This Home
This home is located at 46 Case Dr, Revere, MA 02151 and is currently estimated at $944,437, approximately $419 per square foot. 46 Case Dr is a home located in Suffolk County with nearby schools including A.C. Whelan Elementary School, Staff Sargent James J. Hill Elementary School, and Susan B. Anthony Middle School.
Ownership History
Date
Name
Owned For
Owner Type
Purchase Details
Closed on
Aug 30, 1999
Sold by
Tea Rt
Bought by
Walley Kenneth and Walley Forbes-Kelton C
Current Estimated Value
Purchase Details
Closed on
Oct 3, 1988
Sold by
Fasano Gennaro
Bought by
Celata Richard
Create a Home Valuation Report for This Property
The Home Valuation Report is an in-depth analysis detailing your home's value as well as a comparison with similar homes in the area
Home Values in the Area
Average Home Value in this Area
Purchase History
| Date | Buyer | Sale Price | Title Company |
|---|---|---|---|
| Walley Kenneth | $282,500 | -- | |
| Walley Kenneth | $282,500 | -- | |
| Celata Richard | $300,000 | -- |
Source: Public Records
Mortgage History
| Date | Status | Borrower | Loan Amount |
|---|---|---|---|
| Open | Celata Richard | $250,000 | |
| Closed | Celata Richard | $254,322 |
Source: Public Records
Tax History Compared to Growth
Tax History
| Year | Tax Paid | Tax Assessment Tax Assessment Total Assessment is a certain percentage of the fair market value that is determined by local assessors to be the total taxable value of land and additions on the property. | Land | Improvement |
|---|---|---|---|---|
| 2025 | $7,362 | $811,700 | $296,000 | $515,700 |
| 2024 | $7,268 | $797,800 | $279,600 | $518,200 |
| 2023 | $6,945 | $730,300 | $233,500 | $496,800 |
| 2022 | $6,965 | $669,700 | $222,000 | $447,700 |
| 2021 | $6,821 | $616,700 | $205,600 | $411,100 |
| 2020 | $6,658 | $591,300 | $197,400 | $393,900 |
| 2019 | $6,711 | $554,200 | $207,200 | $347,000 |
| 2018 | $5,916 | $456,500 | $174,300 | $282,200 |
| 2017 | $5,687 | $406,500 | $148,000 | $258,500 |
| 2016 | $5,344 | $369,800 | $134,900 | $234,900 |
| 2015 | $5,473 | $369,800 | $134,900 | $234,900 |
Source: Public Records
Map
Nearby Homes