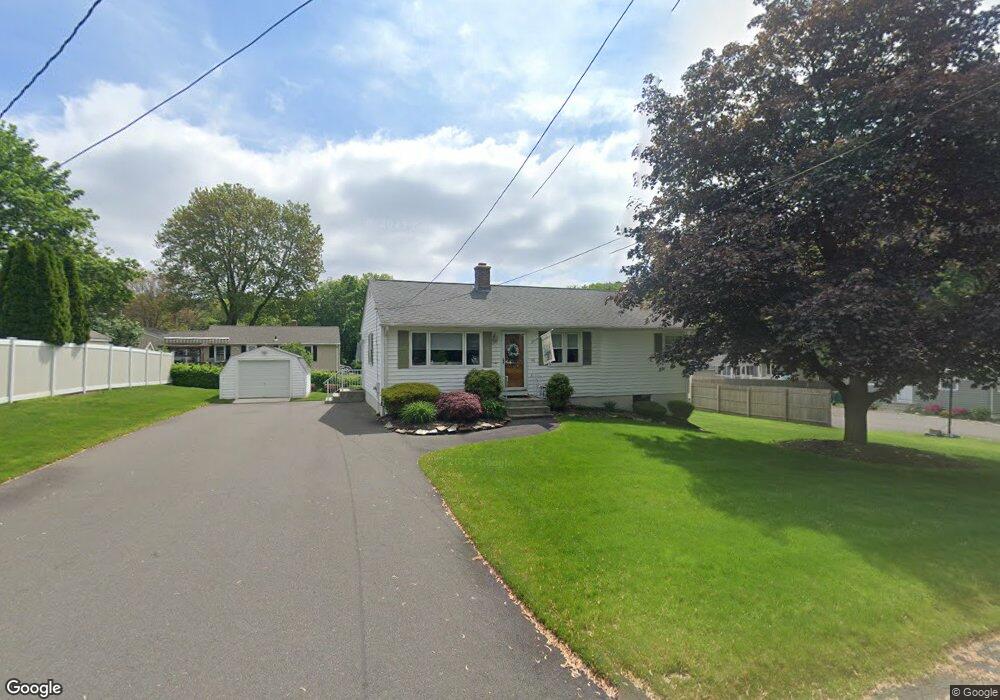
46 Chapin St Feeding Hills, MA 01030
Estimated Value: $270,000 - $353,000
3
Beds
1
Bath
1,026
Sq Ft
$293/Sq Ft
Est. Value
About This Home
This home is located at 46 Chapin St, Feeding Hills, MA 01030 and is currently estimated at $300,668, approximately $293 per square foot. 46 Chapin St is a home located in Hampden County with nearby schools including Agawam Junior High School, Agawam High School, and St Thomas The Apostle School.
Ownership History
Date
Name
Owned For
Owner Type
Purchase Details
Closed on
Jul 26, 2017
Sold by
Kopyscinski Catherine M
Bought by
Kopyscinski Edward J
Current Estimated Value
Home Financials for this Owner
Home Financials are based on the most recent Mortgage that was taken out on this home.
Original Mortgage
$110,000
Outstanding Balance
$58,729
Interest Rate
3.91%
Mortgage Type
New Conventional
Estimated Equity
$241,939
Purchase Details
Closed on
Apr 21, 2011
Sold by
Kopyscinski Richard R and Kopyscinski Catherine M
Bought by
Kopyscinski Edward J
Purchase Details
Closed on
Apr 28, 1965
Bought by
Kopyscinski Richard and Kopyscinski Catherine M
Create a Home Valuation Report for This Property
The Home Valuation Report is an in-depth analysis detailing your home's value as well as a comparison with similar homes in the area
Home Values in the Area
Average Home Value in this Area
Purchase History
| Date | Buyer | Sale Price | Title Company |
|---|---|---|---|
| Kopyscinski Edward J | -- | -- | |
| Kopyscinski Edward J | -- | -- | |
| Kopyscinski Richard | -- | -- |
Source: Public Records
Mortgage History
| Date | Status | Borrower | Loan Amount |
|---|---|---|---|
| Open | Kopyscinski Edward J | $110,000 | |
| Previous Owner | Kopyscinski Richard | $80,000 |
Source: Public Records
Tax History Compared to Growth
Tax History
| Year | Tax Paid | Tax Assessment Tax Assessment Total Assessment is a certain percentage of the fair market value that is determined by local assessors to be the total taxable value of land and additions on the property. | Land | Improvement |
|---|---|---|---|---|
| 2025 | $3,484 | $238,000 | $99,600 | $138,400 |
| 2024 | $3,418 | $235,100 | $99,600 | $135,500 |
| 2023 | $3,219 | $204,000 | $86,200 | $117,800 |
| 2022 | $3,098 | $192,300 | $86,200 | $106,100 |
| 2021 | $2,958 | $176,100 | $77,700 | $98,400 |
| 2020 | $2,893 | $171,900 | $76,500 | $95,400 |
| 2019 | $2,806 | $168,500 | $75,000 | $93,500 |
| 2018 | $2,686 | $161,700 | $75,000 | $86,700 |
| 2017 | $2,561 | $157,000 | $75,000 | $82,000 |
| 2016 | $2,510 | $155,100 | $75,000 | $80,100 |
| 2015 | $2,381 | $151,300 | $75,000 | $76,300 |
Source: Public Records
Map
Nearby Homes
- 64 Blairs Hill Rd
- 468 Springfield St
- 56 Taft St
- 86 Willow Brook Dr
- 712 Cooper St
- 335-337 Springfield St
- 36-38 Rowley St
- lot A North St
- 25 Damato Way
- 94 Witheridge St
- 267 Rowley St
- 67 Colemore St
- 7 Agnoli Place
- 354 Rowley St
- 691 Mill St
- 190 Mill St
- 138 Suffield St
- 50 Howard St
- 73 Silver Lake Dr
- 64 Woodside Dr