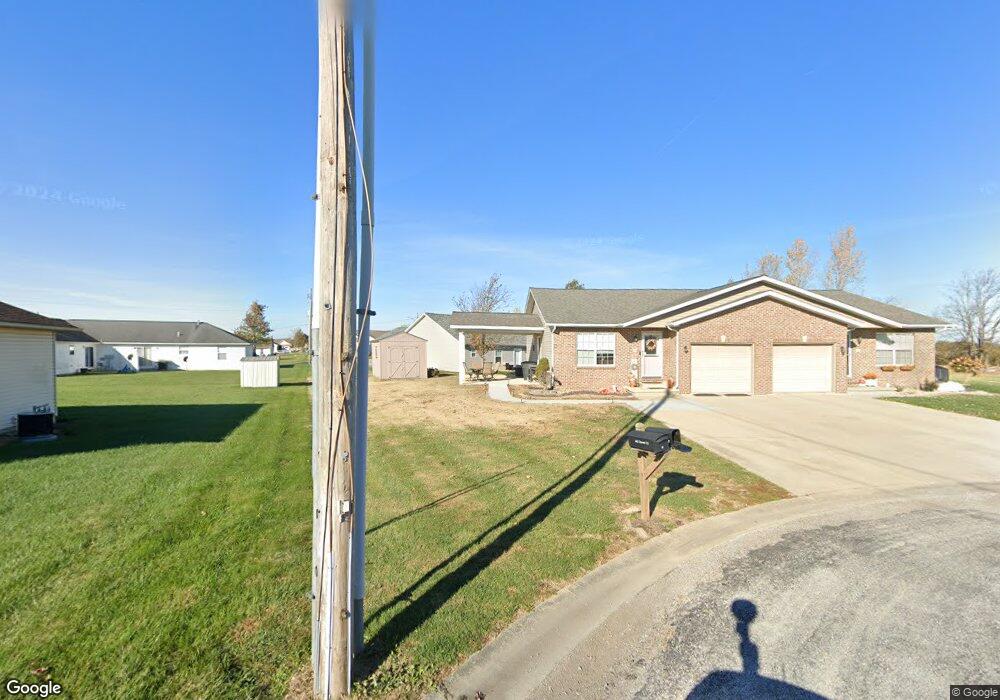
46 Clover Ct Unit 1 Aviston, IL 62216
Estimated Value: $214,000 - $229,485
3
Beds
2
Baths
1,060
Sq Ft
$210/Sq Ft
Est. Value
About This Home
This home is located at 46 Clover Ct Unit 1, Aviston, IL 62216 and is currently estimated at $222,871, approximately $210 per square foot. 46 Clover Ct Unit 1 is a home located in Clinton County with nearby schools including Aviston Elementary School and Central Community High School.
Ownership History
Date
Name
Owned For
Owner Type
Purchase Details
Closed on
Apr 16, 2019
Sold by
Pendergrass Wilford D and Pendergrass Alice A
Bought by
Parker Ryan P and Parker Amanda L
Current Estimated Value
Home Financials for this Owner
Home Financials are based on the most recent Mortgage that was taken out on this home.
Original Mortgage
$132,890
Outstanding Balance
$117,069
Interest Rate
4.4%
Mortgage Type
New Conventional
Estimated Equity
$105,802
Purchase Details
Closed on
Oct 31, 2013
Sold by
Holtgrave Bradley A
Bought by
Pendergrass Wilford D and Pendergrass Alice A
Home Financials for this Owner
Home Financials are based on the most recent Mortgage that was taken out on this home.
Original Mortgage
$125,500
Interest Rate
3.62%
Mortgage Type
VA
Purchase Details
Closed on
Sep 23, 2010
Sold by
Trico Development & Relty Inc
Bought by
Holtgrave Bradley A
Home Financials for this Owner
Home Financials are based on the most recent Mortgage that was taken out on this home.
Original Mortgage
$112,900
Interest Rate
4.45%
Mortgage Type
USDA
Create a Home Valuation Report for This Property
The Home Valuation Report is an in-depth analysis detailing your home's value as well as a comparison with similar homes in the area
Purchase History
| Date | Buyer | Sale Price | Title Company |
|---|---|---|---|
| Parker Ryan P | $137,000 | None Available | |
| Pendergrass Wilford D | $125,500 | Highland Community Title Llc | |
| Holtgrave Bradley A | $112,000 | None Available |
Source: Public Records
Mortgage History
| Date | Status | Borrower | Loan Amount |
|---|---|---|---|
| Open | Parker Ryan P | $132,890 | |
| Previous Owner | Pendergrass Wilford D | $125,500 | |
| Previous Owner | Holtgrave Bradley A | $112,900 |
Source: Public Records
Tax History
| Year | Tax Paid | Tax Assessment Tax Assessment Total Assessment is a certain percentage of the fair market value that is determined by local assessors to be the total taxable value of land and additions on the property. | Land | Improvement |
|---|---|---|---|---|
| 2024 | $3,329 | $57,870 | $5,940 | $51,930 |
| 2023 | $3,329 | $54,590 | $5,600 | $48,990 |
| 2022 | $3,193 | $46,540 | $5,060 | $41,480 |
| 2021 | $2,475 | $44,320 | $4,820 | $39,500 |
| 2020 | $2,455 | $42,610 | $4,630 | $37,980 |
| 2019 | $2,850 | $42,610 | $4,630 | $37,980 |
| 2018 | $0 | $43,019 | $4,326 | $38,693 |
| 2017 | $0 | $40,970 | $4,120 | $36,850 |
| 2016 | $0 | $40,970 | $4,120 | $36,850 |
| 2015 | $1,996 | $40,970 | $4,120 | $36,850 |
| 2013 | $1,996 | $32,990 | $4,120 | $28,870 |
Source: Public Records
Map
Nearby Homes
- 51 W Logan St
- 15 Rosewood Ln
- 4650 Wyatt Way
- 12702 Crestview Ln
- 12746 Rolling Hills Dr
- 3265 Venhaus Rd
- 1144 Emily Ln
- 630 Wedgewood Ln
- 501 Wedgewood Ln
- 525 Wedgewood Ln
- 607 Wedgewood Ln
- 619 Wedgewood Ln
- 437 Galen Dr
- 679 Galen Dr
- 3337 Heavenly Dr
- 436 N Olive St
- 8011 von Bokel Dr
- 25 W Kentucky St
- XXX W 1st St
- 000 Old U S Highway 50
Your Personal Tour Guide
Ask me questions while you tour the home.