
Seller's Agent in 2019
Jane Draughon
RE/MAX
(281) 381-7919
4 in this area
57 Total Sales

Estimated Value: $705,000 - $738,000
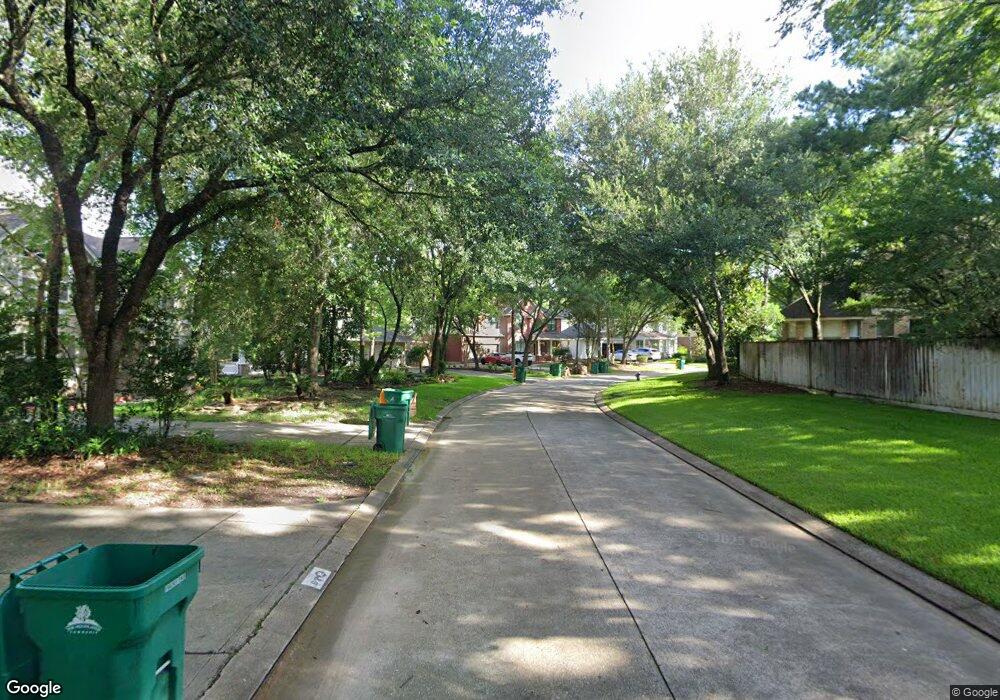
Gorgeous updated five bedroom home in The Woodlands. New wood flooring, new roof, interior paint, fireplace, granite and stainless steel appliances. Master bath has been completely remodeled with travertine. The backyard features a huge patio for entertaining, and another one for basketball or other sports. Plenty of room for a pool and backs to a greenbelt with trees. A covered front porch welcomes guests and offers a friendly place to sit and visit. The two story dining room could also be used as a formal living room. Excellent schools, great shopping and restaurants, golf courses, and entertainment.
Last Agent to Sell the Property
RE/MAX The Woodlands & Spring License #0488287 Listed on: 08/01/2019
| Date | Buyer | Sale Price | Title Company |
|---|---|---|---|
| Desai Dillon Ashish | -- | None Available | |
| Fakhri Alifiya | -- | First American Title | |
| Smith Redd H | -- | None Available | |
| Smith Redd H | -- | American Title Co | |
| Fakhri Alifiya | -- | -- |
| Date | Status | Borrower | Loan Amount |
|---|---|---|---|
| Open | Desai Dillon Ashish | $367,750 | |
| Previous Owner | Smith Redd H | $213,550 |
| Date | Event | Price | List to Sale | Price per Sq Ft |
|---|---|---|---|---|
| 08/18/2024 08/18/24 | Off Market | -- | -- | -- |
| 09/26/2019 09/26/19 | Sold | -- | -- | -- |
| 08/27/2019 08/27/19 | Pending | -- | -- | -- |
| 08/01/2019 08/01/19 | For Sale | $435,000 | -- | $133 / Sq Ft |
| Year | Tax Paid | Tax Assessment Tax Assessment Total Assessment is a certain percentage of the fair market value that is determined by local assessors to be the total taxable value of land and additions on the property. | Land | Improvement |
|---|---|---|---|---|
| 2025 | $8,536 | $617,100 | -- | -- |
| 2024 | $7,727 | $561,000 | -- | -- |
| 2023 | $7,727 | $510,000 | $90,000 | $420,000 |
| 2022 | $9,585 | $472,910 | $90,000 | $420,000 |
| 2021 | $9,377 | $429,920 | $40,320 | $389,600 |
| 2020 | $9,964 | $430,740 | $40,320 | $390,420 |
| 2019 | $9,599 | $402,190 | $40,320 | $361,870 |
| 2018 | $8,384 | $390,120 | $40,320 | $349,800 |
| 2017 | $9,331 | $386,220 | $40,320 | $345,900 |
| 2016 | $10,254 | $424,440 | $40,320 | $384,120 |
| 2015 | $9,825 | $414,210 | $40,320 | $373,890 |
| 2014 | $9,825 | $403,940 | $40,320 | $363,620 |
Seller's Agent in 2019
Jane Draughon
RE/MAX
(281) 381-7919
4 in this area
57 Total Sales
Buyer's Agent in 2019
Beth Ferester
Corcoran Genesis
(713) 702-6334
14 in this area
184 Total Sales
Source: Houston Association of REALTORS®
MLS Number: 73553229
APN: 9719-54-01900
Disclaimer: Certain information contained herein is derived from information provided by parties other than Homes.com. All information provided is deemed reliable, but is not guaranteed to be accurate and should be independently verified.
![]() Copyright 2026, Houston REALTORS® Information Service, Inc.
Copyright 2026, Houston REALTORS® Information Service, Inc.
The information provided is exclusively for consumers’ personal, non-commercial use, and may not be used for any purpose other than to identify prospective properties consumers may be interested in purchasing.
Information is deemed reliable but not guaranteed.
Ask me questions while you tour the home.