Estimated Value: $114,408 - $403,000
6
Beds
3
Baths
3,339
Sq Ft
$90/Sq Ft
Est. Value
About This Home
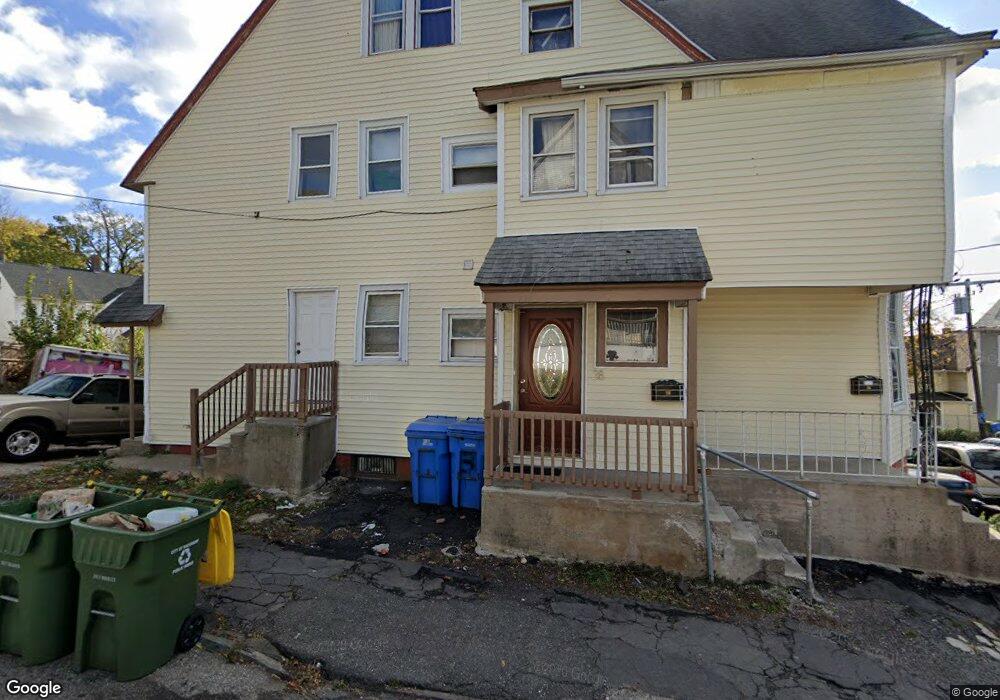
This home is located at 46 Coe St, Waterbury, CT 06704 and is currently estimated at $302,102, approximately $90 per square foot. 46 Coe St is a home located in New Haven County with nearby schools including B.W. Tinker School, West Side Middle School, and John F. Kennedy High School.
Ownership History
Date
Name
Owned For
Owner Type
Purchase Details
Closed on
Nov 14, 2016
Sold by
Valentin Moises
Bought by
Lozada Remodeling Llc
Current Estimated Value
Purchase Details
Closed on
Dec 11, 2009
Sold by
Fhlmc
Bought by
Valentin Moises
Purchase Details
Closed on
Sep 14, 2009
Sold by
Williams Alfred M Est
Bought by
Fhlmc
Purchase Details
Closed on
Aug 30, 2007
Sold by
Daughma Horald G
Bought by
Williams Alfrede M
Home Financials for this Owner
Home Financials are based on the most recent Mortgage that was taken out on this home.
Original Mortgage
$159,080
Interest Rate
6.71%
Mortgage Type
Purchase Money Mortgage
Purchase Details
Closed on
Jan 3, 2006
Sold by
Whyte Jonathan
Bought by
Daughma Horald
Home Financials for this Owner
Home Financials are based on the most recent Mortgage that was taken out on this home.
Original Mortgage
$96,900
Interest Rate
6.39%
Mortgage Type
Purchase Money Mortgage
Create a Home Valuation Report for This Property
The Home Valuation Report is an in-depth analysis detailing your home's value as well as a comparison with similar homes in the area
Home Values in the Area
Average Home Value in this Area
Purchase History
| Date | Buyer | Sale Price | Title Company |
|---|---|---|---|
| Lozada Remodeling Llc | $60,000 | -- | |
| Valentin Moises | $25,000 | -- | |
| Fhlmc | -- | -- | |
| Williams Alfrede M | $164,000 | -- | |
| Daughma Horald | $114,000 | -- |
Source: Public Records
Mortgage History
| Date | Status | Borrower | Loan Amount |
|---|---|---|---|
| Previous Owner | Daughma Horald | $159,080 | |
| Previous Owner | Daughma Horald | $96,900 |
Source: Public Records
Tax History Compared to Growth
Tax History
| Year | Tax Paid | Tax Assessment Tax Assessment Total Assessment is a certain percentage of the fair market value that is determined by local assessors to be the total taxable value of land and additions on the property. | Land | Improvement |
|---|---|---|---|---|
| 2025 | $4,128 | $91,770 | $7,000 | $84,770 |
| 2024 | $4,537 | $91,770 | $7,000 | $84,770 |
| 2023 | $4,973 | $91,770 | $7,000 | $84,770 |
| 2022 | $2,665 | $44,260 | $6,980 | $37,280 |
| 2021 | $2,665 | $44,260 | $6,980 | $37,280 |
| 2020 | $2,665 | $44,260 | $6,980 | $37,280 |
| 2019 | $2,665 | $44,260 | $6,980 | $37,280 |
| 2018 | $2,665 | $44,260 | $6,980 | $37,280 |
| 2017 | $2,596 | $43,110 | $6,980 | $36,130 |
| 2016 | $2,596 | $43,110 | $6,980 | $36,130 |
| 2015 | $2,510 | $43,110 | $6,980 | $36,130 |
| 2014 | $2,510 | $43,110 | $6,980 | $36,130 |
Source: Public Records
Map
Nearby Homes