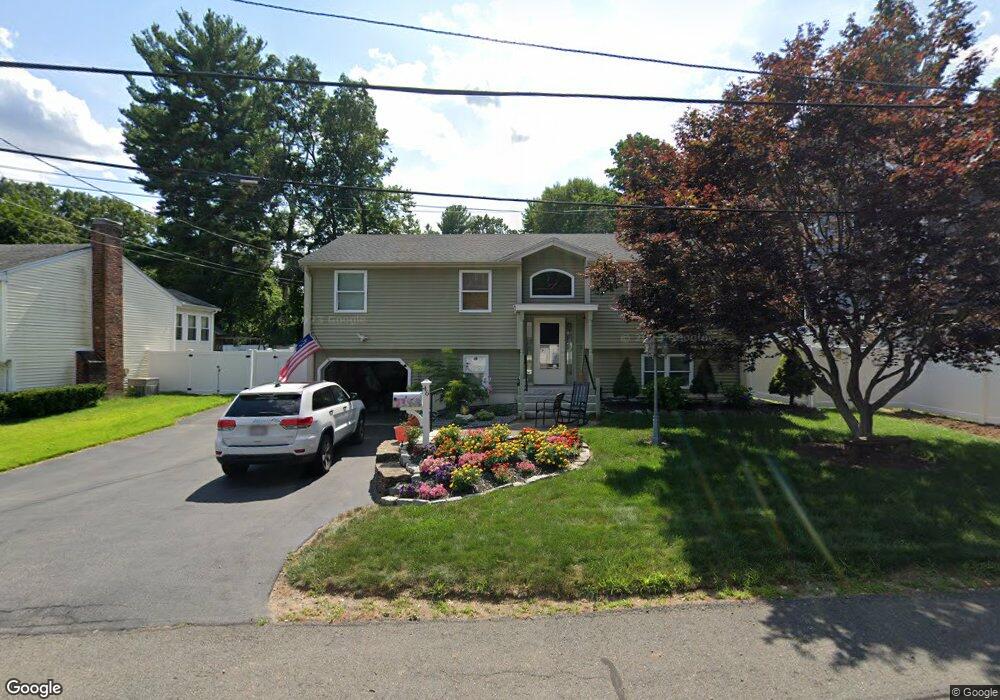
46 Colburn Rd Reading, MA 01867
Estimated Value: $786,000 - $956,000
3
Beds
3
Baths
1,886
Sq Ft
$457/Sq Ft
Est. Value
About This Home
This home is located at 46 Colburn Rd, Reading, MA 01867 and is currently estimated at $862,432, approximately $457 per square foot. 46 Colburn Rd is a home located in Middlesex County with nearby schools including Birch Meadow Elementary School, Arthur W. Coolidge Middle School, and Reading Memorial High School.
Ownership History
Date
Name
Owned For
Owner Type
Purchase Details
Closed on
Apr 13, 1998
Sold by
Ripa David A and Ripa Brenda J
Bought by
Sciuto Paul J and Sciuto Janine M
Current Estimated Value
Home Financials for this Owner
Home Financials are based on the most recent Mortgage that was taken out on this home.
Original Mortgage
$200,000
Interest Rate
6.98%
Mortgage Type
Purchase Money Mortgage
Create a Home Valuation Report for This Property
The Home Valuation Report is an in-depth analysis detailing your home's value as well as a comparison with similar homes in the area
Home Values in the Area
Average Home Value in this Area
Purchase History
| Date | Buyer | Sale Price | Title Company |
|---|---|---|---|
| Sciuto Paul J | $225,000 | -- |
Source: Public Records
Mortgage History
| Date | Status | Borrower | Loan Amount |
|---|---|---|---|
| Open | Sciuto Paul J | $336,000 | |
| Closed | Sciuto Paul J | $234,000 | |
| Closed | Sciuto Paul J | $200,000 |
Source: Public Records
Tax History
| Year | Tax Paid | Tax Assessment Tax Assessment Total Assessment is a certain percentage of the fair market value that is determined by local assessors to be the total taxable value of land and additions on the property. | Land | Improvement |
|---|---|---|---|---|
| 2025 | $9,138 | $802,300 | $477,200 | $325,100 |
| 2024 | $9,035 | $770,900 | $458,400 | $312,500 |
| 2023 | $8,754 | $695,300 | $413,300 | $282,000 |
| 2022 | $8,153 | $611,600 | $375,800 | $235,800 |
| 2021 | $8,240 | $596,700 | $360,100 | $236,600 |
| 2020 | $7,922 | $567,900 | $342,600 | $225,300 |
| 2019 | $12,160 | $541,200 | $326,400 | $214,800 |
| 2018 | $7,081 | $510,500 | $307,800 | $202,700 |
| 2017 | $10,980 | $481,800 | $290,400 | $191,400 |
| 2016 | $6,299 | $434,400 | $260,200 | $174,200 |
| 2015 | $5,904 | $401,600 | $240,400 | $161,200 |
| 2014 | $5,722 | $388,200 | $232,300 | $155,900 |
Source: Public Records
Map
Nearby Homes
- 119 Van Norden Rd
- 50 Forest St
- 99 Grove St
- 150 Grove St
- 44 Grandview Rd
- 16 Briarwood Ave
- 27 Audubon Rd
- 32 Granger Ave
- 141 Belmont St
- 68 Sanborn Ln
- 11 Clover Cir Unit A
- 17 Courtyard Place Unit 17
- 5 Washington St Unit D4
- 5 Washington St Unit A5
- 0 Charles St Unit 72374573
- 101 King St Unit 101
- 2 Inwood Dr Unit 1005
- 30 Taylor Dr Unit 3011
- 18 Symonds Way
- 41 Winter St
- 42 Colburn Rd
- 52 Colburn Rd
- 45 Dunbar Rd
- 36 Colburn Rd
- 45 Colburn Rd
- 35 Dunbar Rd
- 41 Colburn Rd
- 58 Colburn Rd
- 51 Colburn Rd
- 51 Colburn Rd Unit 51
- 51 Colburn Rd Unit Single Fam
- 37 Colburn Rd
- 57 Colburn Rd
- 29 Colburn Rd
- 28 Colburn Rd
- 36 Dunbar Rd
- 27 Dunbar Rd
- 63 Colburn Rd
- 27 Colburn Rd
- 26 Hurlburt Rd
Your Personal Tour Guide
Ask me questions while you tour the home.