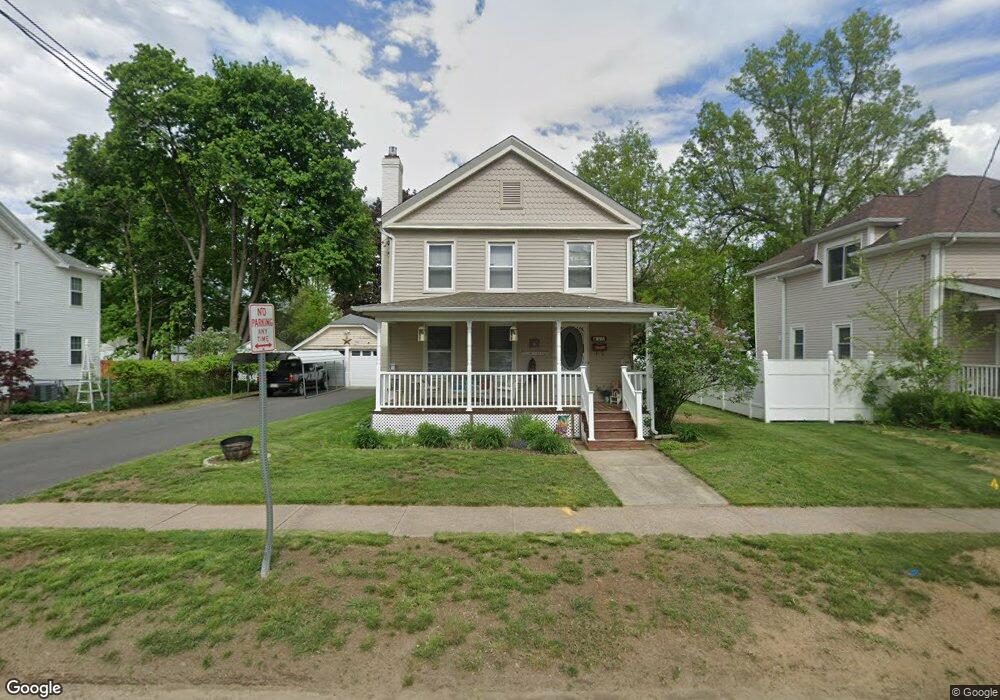
46 Cooper St West Springfield, MA 01089
Estimated Value: $296,000 - $346,000
3
Beds
1
Bath
1,540
Sq Ft
$205/Sq Ft
Est. Value
About This Home
This home is located at 46 Cooper St, West Springfield, MA 01089 and is currently estimated at $315,318, approximately $204 per square foot. 46 Cooper St is a home located in Hampden County with nearby schools including West Springfield High School and St Thomas The Apostle School.
Ownership History
Date
Name
Owned For
Owner Type
Purchase Details
Closed on
Aug 23, 1999
Sold by
Department Of Housing & Urban Dev
Bought by
Topjian Robert S and Topjian Laurie M
Current Estimated Value
Home Financials for this Owner
Home Financials are based on the most recent Mortgage that was taken out on this home.
Original Mortgage
$82,175
Interest Rate
7.6%
Mortgage Type
Purchase Money Mortgage
Purchase Details
Closed on
Nov 24, 1998
Sold by
Bartlett Todd S and Bartlett Gisele A
Bought by
Norwest Mtg Inc
Purchase Details
Closed on
Oct 31, 1995
Sold by
Thomas Robert J and Thomas Barbara A
Bought by
Bartlett Todd S and Bartlett Gisele A
Home Financials for this Owner
Home Financials are based on the most recent Mortgage that was taken out on this home.
Original Mortgage
$85,050
Interest Rate
7.6%
Mortgage Type
Purchase Money Mortgage
Create a Home Valuation Report for This Property
The Home Valuation Report is an in-depth analysis detailing your home's value as well as a comparison with similar homes in the area
Home Values in the Area
Average Home Value in this Area
Purchase History
| Date | Buyer | Sale Price | Title Company |
|---|---|---|---|
| Topjian Robert S | $86,500 | -- | |
| Norwest Mtg Inc | $95,561 | -- | |
| Bartlett Todd S | $88,900 | -- |
Source: Public Records
Mortgage History
| Date | Status | Borrower | Loan Amount |
|---|---|---|---|
| Open | Bartlett Todd S | $85,000 | |
| Closed | Bartlett Todd S | $82,175 | |
| Previous Owner | Bartlett Todd S | $85,050 |
Source: Public Records
Tax History
| Year | Tax Paid | Tax Assessment Tax Assessment Total Assessment is a certain percentage of the fair market value that is determined by local assessors to be the total taxable value of land and additions on the property. | Land | Improvement |
|---|---|---|---|---|
| 2025 | $4,070 | $273,700 | $97,900 | $175,800 |
| 2024 | $3,834 | $258,900 | $97,900 | $161,000 |
| 2023 | $3,624 | $233,200 | $95,800 | $137,400 |
| 2022 | $3,280 | $208,100 | $87,000 | $121,100 |
| 2021 | $3,155 | $186,700 | $79,400 | $107,300 |
| 2020 | $3,172 | $186,700 | $79,400 | $107,300 |
| 2019 | $3,166 | $186,700 | $79,400 | $107,300 |
| 2018 | $3,183 | $186,700 | $79,400 | $107,300 |
| 2017 | $3,183 | $186,700 | $79,400 | $107,300 |
| 2016 | $3,092 | $182,000 | $74,700 | $107,300 |
| 2015 | $3,143 | $185,000 | $73,200 | $111,800 |
| 2014 | $762 | $185,000 | $73,200 | $111,800 |
Source: Public Records
Map
Nearby Homes
Your Personal Tour Guide
Ask me questions while you tour the home.