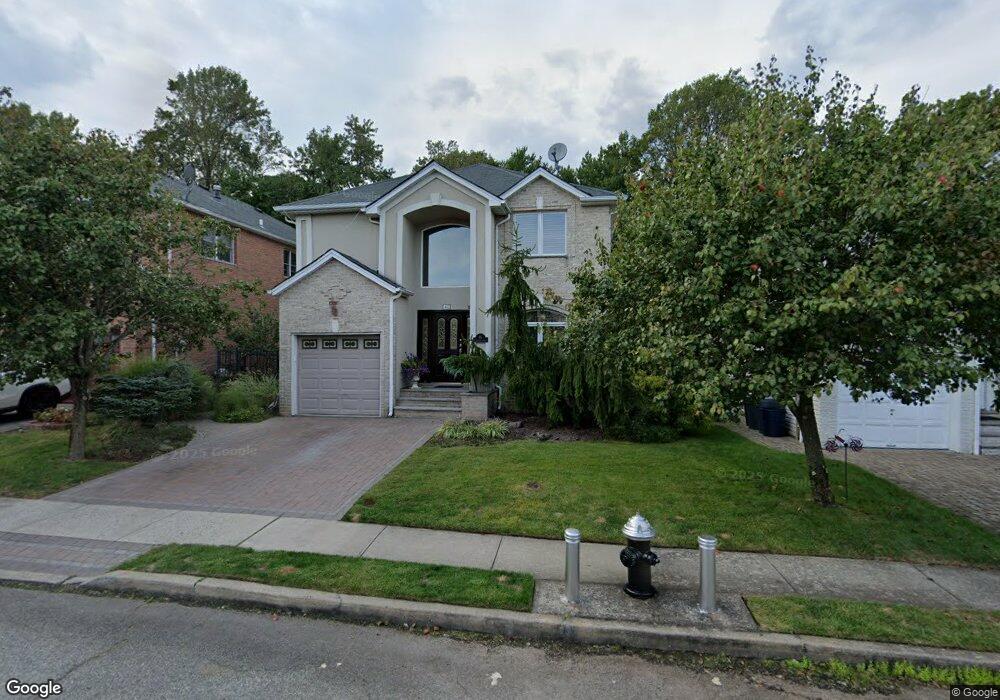
46 Covington Cir Staten Island, NY 10312
Huguenot NeighborhoodEstimated Value: $1,162,842 - $1,298,000
4
Beds
3
Baths
3,278
Sq Ft
$376/Sq Ft
Est. Value
About This Home
This home is located at 46 Covington Cir, Staten Island, NY 10312 and is currently estimated at $1,233,461, approximately $376 per square foot. 46 Covington Cir is a home located in Richmond County with nearby schools including P.S. 4 - Maurice Wollin, I.S. 075 Frank D. Paulo, and Tottenville High School.
Ownership History
Date
Name
Owned For
Owner Type
Purchase Details
Closed on
Aug 1, 2007
Sold by
Solodkin Leonid and Labazova Dana
Bought by
Labazova Dana
Current Estimated Value
Purchase Details
Closed on
Oct 14, 2005
Sold by
Broder Bernadette
Bought by
Solodkin Leonid and Labazova Dana
Home Financials for this Owner
Home Financials are based on the most recent Mortgage that was taken out on this home.
Original Mortgage
$344,000
Outstanding Balance
$187,706
Interest Rate
6.07%
Mortgage Type
Purchase Money Mortgage
Estimated Equity
$1,045,755
Purchase Details
Closed on
Sep 13, 2000
Sold by
Dora Homes Inc
Bought by
Broder David and Broder Bernadette
Home Financials for this Owner
Home Financials are based on the most recent Mortgage that was taken out on this home.
Original Mortgage
$300,000
Interest Rate
7.12%
Create a Home Valuation Report for This Property
The Home Valuation Report is an in-depth analysis detailing your home's value as well as a comparison with similar homes in the area
Home Values in the Area
Average Home Value in this Area
Purchase History
| Date | Buyer | Sale Price | Title Company |
|---|---|---|---|
| Labazova Dana | -- | None Available | |
| Solodkin Leonid | $770,000 | Stewart Title | |
| Broder David | $456,500 | -- |
Source: Public Records
Mortgage History
| Date | Status | Borrower | Loan Amount |
|---|---|---|---|
| Open | Solodkin Leonid | $344,000 | |
| Previous Owner | Broder David | $300,000 |
Source: Public Records
Tax History
| Year | Tax Paid | Tax Assessment Tax Assessment Total Assessment is a certain percentage of the fair market value that is determined by local assessors to be the total taxable value of land and additions on the property. | Land | Improvement |
|---|---|---|---|---|
| 2025 | $12,160 | $69,180 | $12,423 | $56,757 |
| 2024 | $12,159 | $63,180 | $13,396 | $49,784 |
| 2023 | $12,272 | $60,428 | $12,549 | $47,879 |
| 2022 | $11,381 | $60,720 | $13,980 | $46,740 |
| 2021 | $11,417 | $54,480 | $13,920 | $40,560 |
| 2020 | $10,833 | $51,180 | $13,920 | $37,260 |
| 2019 | $10,543 | $50,400 | $13,920 | $36,480 |
| 2018 | $10,255 | $50,307 | $13,524 | $36,783 |
| 2017 | $9,675 | $47,460 | $13,920 | $33,540 |
| 2016 | $9,200 | $46,020 | $13,920 | $32,100 |
| 2015 | $8,486 | $45,240 | $11,580 | $33,660 |
| 2014 | $8,486 | $44,220 | $11,580 | $32,640 |
Source: Public Records
Map
Nearby Homes
- 115 Covington Cir
- 86 W Castor Place
- 121 Dahlia St
- 176 Russek Dr
- 147 Russek Dr Unit 47
- 23 Stack Dr
- 112 Rosedale Ave
- 107 Cardiff St
- 629 Marcy Ave
- 521 Correll Ave
- 727 Stafford Ave
- 45 Russek Dr
- 12 Walker Place
- 119 Boulder St
- 3 Ebey Ln
- 0 Woodrow Rd Unit 2601807
- 573 Correll Ave
- 799 Stafford Ave
- 39 Selkirk St
- 139 Gervil St Unit 53
- 44 Covington Cir
- 48 Covington Cir
- 42 Covington Cir
- 52 Covington Cir
- 40 Covington Cir
- 56 Covington Cir
- 61 Covington Cir
- 45 Covington Cir
- 60 Covington Cir
- 38 Covington Cir
- 43 Covington Cir
- 62 Covington Cir
- 63 Covington Cir
- 36 Covington Cir
- 39 Covington Cir
- 64 Covington Cir
- 65 Covington Cir
- 46 Wycliff Ln
- 34 Covington Cir
- 44 Wycliff Ln
Your Personal Tour Guide
Ask me questions while you tour the home.