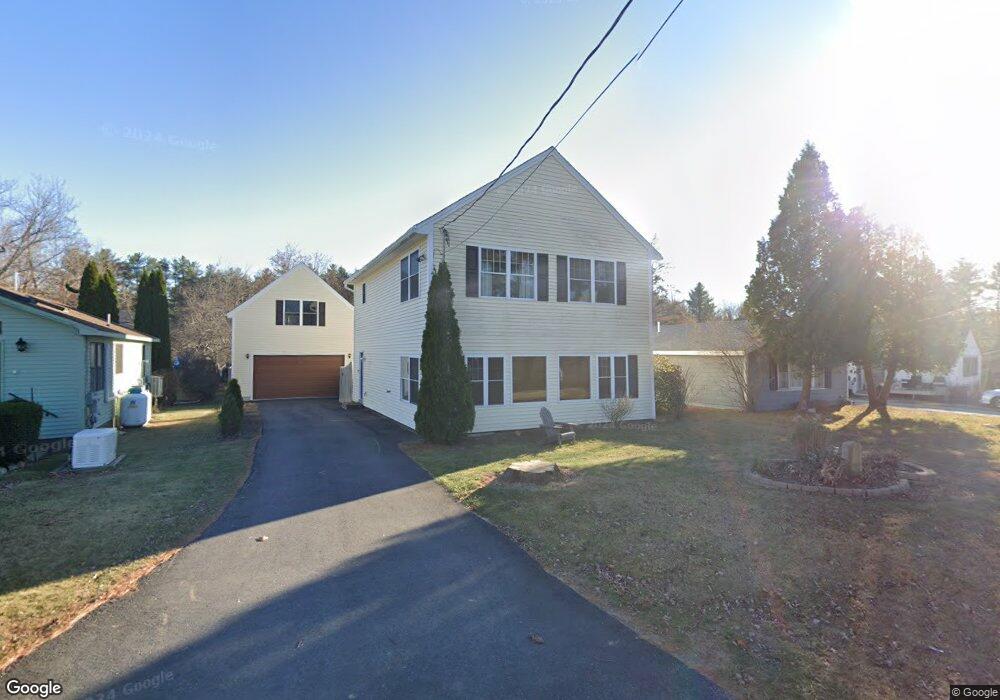
46 Crockett Rd Raymond, ME 04071
Estimated Value: $502,000 - $676,000
2
Beds
2
Baths
1,750
Sq Ft
$352/Sq Ft
Est. Value
About This Home
This home is located at 46 Crockett Rd, Raymond, ME 04071 and is currently estimated at $616,536, approximately $352 per square foot. 46 Crockett Rd is a home located in Cumberland County with nearby schools including Raymond Elementary School, Jordan-Small Middle School, and Windham High School.
Ownership History
Date
Name
Owned For
Owner Type
Purchase Details
Closed on
Jul 15, 2024
Sold by
Lewis Debra M and Lewis Michael J
Bought by
Flagg Arthur J and Flagg Christine C
Current Estimated Value
Home Financials for this Owner
Home Financials are based on the most recent Mortgage that was taken out on this home.
Original Mortgage
$480,000
Outstanding Balance
$473,708
Interest Rate
6.88%
Mortgage Type
Purchase Money Mortgage
Estimated Equity
$142,828
Purchase Details
Closed on
Dec 31, 2008
Sold by
Miller Craig P and Lowell James
Bought by
Lowell James and Lewis Micheal J
Purchase Details
Closed on
Feb 29, 2008
Sold by
Bean Janet B
Bought by
Miller Craig P and Lowell James R
Home Financials for this Owner
Home Financials are based on the most recent Mortgage that was taken out on this home.
Original Mortgage
$148,000
Interest Rate
5.8%
Mortgage Type
Unknown
Create a Home Valuation Report for This Property
The Home Valuation Report is an in-depth analysis detailing your home's value as well as a comparison with similar homes in the area
Home Values in the Area
Average Home Value in this Area
Purchase History
| Date | Buyer | Sale Price | Title Company |
|---|---|---|---|
| Flagg Arthur J | $640,000 | None Available | |
| Flagg Arthur J | $640,000 | None Available | |
| Lowell James | -- | -- | |
| Miller Craig P | $1,001 | -- | |
| Lowell James | -- | -- | |
| Miller Craig P | $1,001 | -- |
Source: Public Records
Mortgage History
| Date | Status | Borrower | Loan Amount |
|---|---|---|---|
| Open | Flagg Arthur J | $480,000 | |
| Closed | Flagg Arthur J | $480,000 | |
| Previous Owner | Miller Craig P | $148,000 |
Source: Public Records
Tax History Compared to Growth
Tax History
| Year | Tax Paid | Tax Assessment Tax Assessment Total Assessment is a certain percentage of the fair market value that is determined by local assessors to be the total taxable value of land and additions on the property. | Land | Improvement |
|---|---|---|---|---|
| 2024 | $4,823 | $280,400 | $109,800 | $170,600 |
| 2023 | $4,458 | $280,400 | $109,800 | $170,600 |
| 2022 | $4,206 | $280,400 | $109,800 | $170,600 |
| 2021 | $3,954 | $280,400 | $109,800 | $170,600 |
| 2019 | $3,634 | $270,200 | $109,800 | $160,400 |
| 2018 | $3,646 | $270,200 | $109,800 | $160,400 |
| 2017 | $3,323 | $270,200 | $109,800 | $160,400 |
| 2016 | $3,269 | $270,200 | $109,800 | $160,400 |
| 2015 | $3,229 | $270,200 | $109,800 | $160,400 |
| 2014 | $3,188 | $270,200 | $109,800 | $160,400 |
| 2013 | $3,040 | $270,200 | $109,800 | $160,400 |
Source: Public Records
Map
Nearby Homes
- 16 Peterson Rd
- 1 Pine Ln
- 24 Hillside Dr
- 18 Hillside Dr
- 7 Salmon Run
- 20 Bittersweet Way
- 6 Williams Ln
- 2 Flynn Rd
- 1083 Roosevelt Trail
- 89 Shaw Rd
- 1042 Roosevelt Trail
- 105 Meadow Rd
- 34 Stoney Brook Rd
- lot #8 Bedrock Terrace
- 17 Murray Dr
- 99 Enterprise Dr
- 7 Gore Rd
- 15 Worcester Dr
- 42 Bracken Woods Rd
- 12 Presidential View
- 50 Crockett Rd
- 44 Crockett Rd
- 52 Crockett Rd
- 42 Crockett Rd
- 18 Caton Rd
- 24 Crockett Rd
- 54 Crockett Rd
- 56 Crockett Rd
- 41 Crockett Rd
- 45 Crockett Rd
- 37 Crockett Rd
- 37 Crockett Rd Unit ID1255622P
- 58 Crockett Rd
- 49 Crockett Rd
- 35 Crockett Rd
- 16 Caton Rd
- 34 Crockett Rd
- 51 Crockett Rd
- 33 Crockett Rd
- 60 Crockett Rd