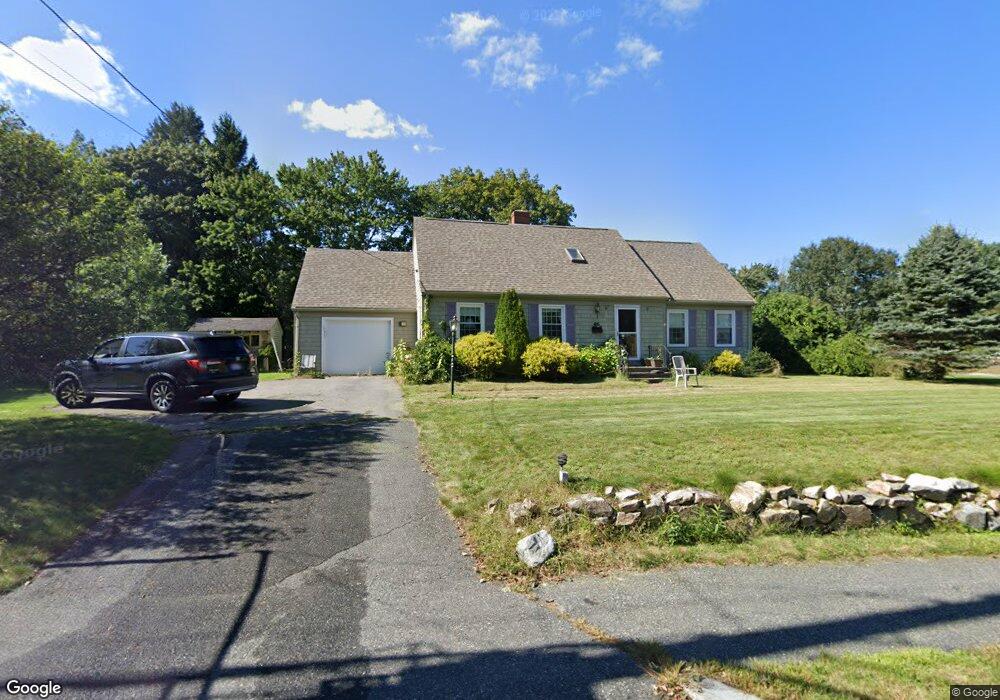
46 Curve St Medfield, MA 02052
Estimated Value: $876,000 - $1,117,000
4
Beds
3
Baths
2,051
Sq Ft
$462/Sq Ft
Est. Value
About This Home
This home is located at 46 Curve St, Medfield, MA 02052 and is currently estimated at $947,396, approximately $461 per square foot. 46 Curve St is a home located in Norfolk County with nearby schools including Ralph Wheelock School, Memorial School, and Dale Street School.
Ownership History
Date
Name
Owned For
Owner Type
Purchase Details
Closed on
Apr 23, 2018
Sold by
Hayes Stephen M
Bought by
Hayes Stephen M and Hayes Maureen
Current Estimated Value
Purchase Details
Closed on
Dec 1, 1972
Bought by
Hayes Thomas J
Create a Home Valuation Report for This Property
The Home Valuation Report is an in-depth analysis detailing your home's value as well as a comparison with similar homes in the area
Home Values in the Area
Average Home Value in this Area
Purchase History
| Date | Buyer | Sale Price | Title Company |
|---|---|---|---|
| Hayes Stephen M | -- | -- | |
| Hayes Stephen M | -- | -- | |
| Hayes Stephen M | $173,250 | -- | |
| Hayes Stephen M | $173,250 | -- | |
| Hayes Thomas J | -- | -- |
Source: Public Records
Mortgage History
| Date | Status | Borrower | Loan Amount |
|---|---|---|---|
| Previous Owner | Hayes Thomas J | $5,000 | |
| Previous Owner | Hayes Thomas J | $50,000 |
Source: Public Records
Tax History Compared to Growth
Tax History
| Year | Tax Paid | Tax Assessment Tax Assessment Total Assessment is a certain percentage of the fair market value that is determined by local assessors to be the total taxable value of land and additions on the property. | Land | Improvement |
|---|---|---|---|---|
| 2025 | $9,486 | $687,400 | $340,500 | $346,900 |
| 2024 | $9,390 | $641,400 | $315,600 | $325,800 |
| 2023 | $9,212 | $597,000 | $299,000 | $298,000 |
| 2022 | $8,668 | $497,600 | $282,400 | $215,200 |
| 2021 | $8,363 | $470,900 | $274,100 | $196,800 |
| 2020 | $8,170 | $458,200 | $267,400 | $190,800 |
| 2019 | $7,877 | $440,800 | $257,400 | $183,400 |
| 2018 | $7,045 | $413,700 | $240,800 | $172,900 |
| 2017 | $6,288 | $372,300 | $232,500 | $139,800 |
| 2016 | $6,209 | $370,700 | $230,900 | $139,800 |
| 2015 | $6,222 | $387,900 | $247,900 | $140,000 |
| 2014 | $6,018 | $373,300 | $233,300 | $140,000 |
Source: Public Records
Map
Nearby Homes
- 94 Pleasant St
- 23 Cross St
- 431 Main St Unit 5
- 34 Frairy St
- 10 Hillcrest Rd
- 43 Green St Unit 43
- 46 Frairy St
- 8 Turtlebrook Way
- 3 Hennery Way Bld E Unit 3
- 18 Hearthstone Dr
- 111 Elm St
- 270 South St
- 54 Wagon Rd
- 24 Pine Hill Dr
- 80 West St
- 11 Hickory Ln
- 26 Rocky Ln
- 6 Alcott Way
- 3 Shining Valley Cir
- 32 Homeward Ln