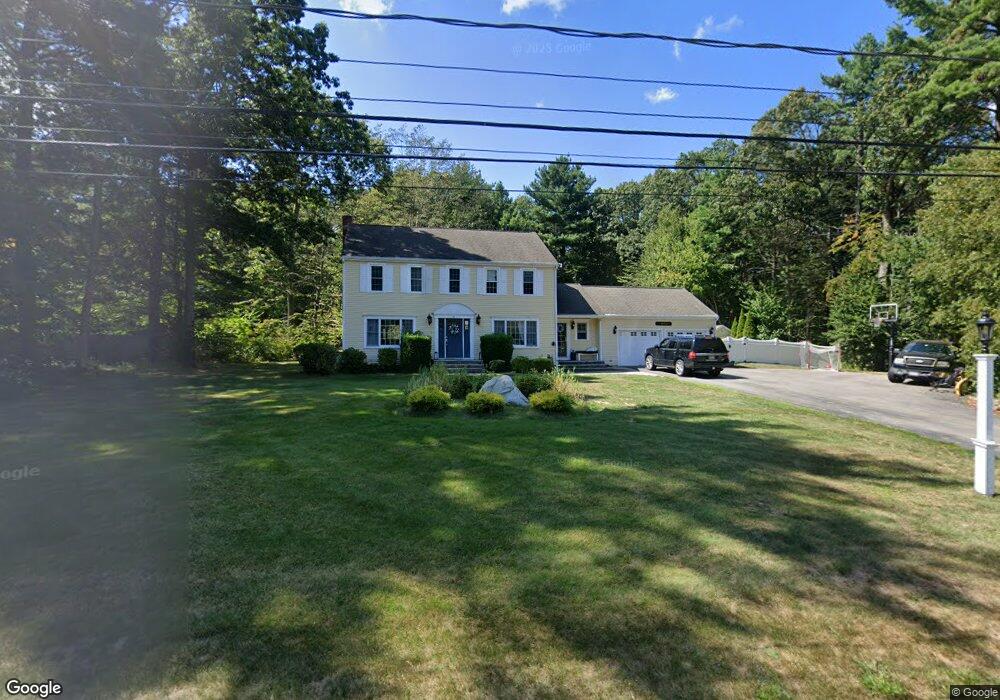
46 Cushing Hill Rd Hanover, MA 02339
Estimated Value: $1,028,000 - $1,346,000
4
Beds
3
Baths
2,666
Sq Ft
$436/Sq Ft
Est. Value
About This Home
This home is located at 46 Cushing Hill Rd, Hanover, MA 02339 and is currently estimated at $1,161,073, approximately $435 per square foot. 46 Cushing Hill Rd is a home located in Plymouth County with nearby schools including Hanover High School, South Shore Charter Public School, and Norwell KinderCare.
Ownership History
Date
Name
Owned For
Owner Type
Purchase Details
Closed on
Aug 13, 2019
Sold by
Marini Michael D and Marini Italia L
Bought by
Cronin Patrick and Cronin Denise
Current Estimated Value
Home Financials for this Owner
Home Financials are based on the most recent Mortgage that was taken out on this home.
Original Mortgage
$605,000
Outstanding Balance
$527,563
Interest Rate
3.7%
Mortgage Type
New Conventional
Estimated Equity
$633,510
Purchase Details
Closed on
Jul 30, 1999
Sold by
Macdonald Charles and Macdonald Linda K
Bought by
Marini Michael D and Marini Tialia L
Purchase Details
Closed on
Sep 1, 1998
Sold by
Stout Franklin G and Stout Eileen M
Bought by
Macdonald Charles and Macdonald Linda K
Create a Home Valuation Report for This Property
The Home Valuation Report is an in-depth analysis detailing your home's value as well as a comparison with similar homes in the area
Home Values in the Area
Average Home Value in this Area
Purchase History
| Date | Buyer | Sale Price | Title Company |
|---|---|---|---|
| Cronin Patrick | $805,000 | -- | |
| Cronin Patrick | $805,000 | -- | |
| Marini Michael D | $325,000 | -- | |
| Marini Michael D | $325,000 | -- | |
| Macdonald Charles | $302,500 | -- | |
| Macdonald Charles | $302,500 | -- |
Source: Public Records
Mortgage History
| Date | Status | Borrower | Loan Amount |
|---|---|---|---|
| Open | Cronin Patrick | $605,000 | |
| Closed | Cronin Patrick | $605,000 | |
| Previous Owner | Macdonald Charles | $180,000 | |
| Previous Owner | Macdonald Charles | $175,550 |
Source: Public Records
Tax History
| Year | Tax Paid | Tax Assessment Tax Assessment Total Assessment is a certain percentage of the fair market value that is determined by local assessors to be the total taxable value of land and additions on the property. | Land | Improvement |
|---|---|---|---|---|
| 2025 | $12,439 | $1,007,200 | $339,700 | $667,500 |
| 2024 | $12,121 | $944,000 | $339,700 | $604,300 |
| 2023 | $11,662 | $864,500 | $308,700 | $555,800 |
| 2022 | $11,660 | $764,600 | $271,700 | $492,900 |
| 2021 | $11,678 | $715,100 | $247,400 | $467,700 |
| 2020 | $11,337 | $695,100 | $247,400 | $447,700 |
| 2019 | $11,316 | $689,600 | $269,900 | $419,700 |
| 2018 | $10,582 | $650,000 | $269,900 | $380,100 |
| 2017 | $10,152 | $614,500 | $276,200 | $338,300 |
| 2016 | $9,813 | $582,000 | $251,000 | $331,000 |
| 2015 | $9,399 | $582,000 | $251,000 | $331,000 |
Source: Public Records
Map
Nearby Homes
- 46 Brookwood Rd
- 18 Winterberry Ln
- 535 Webster St
- 738 Whiting St
- 36 Bayberry Ln
- 47 Stone Meadow Ln
- 776 Main St
- 303 Pond St
- 8 Blueberry Ct
- 49 Washington Park Dr
- 67 Henderson Ln
- 26 Hobart Ln Unit 26,C
- 55 Turner Rd
- 18 Colby St
- 206-208 Hinghm St
- 214 Washington St Unit 24
- 214 Washington St Unit 28
- 1 Von Rhor Dr Unit 1
- 53 Chestnut St
- 506 Main St
- 60 Cushing Hill Rd
- 39 Cushing Hill Rd
- 47 Cushing Hill Rd
- 63 Cushing Hill Rd
- 38 Damon Rd
- 30 Cushing Hill Rd
- 50 Damon Rd
- 25 Cushing Hill Rd
- 62 Damon Rd
- 18 Damon Rd
- 793 Webster St
- 813 Webster St
- 799 Webster St
- 72 Damon Rd
- 15 Cushing Hill Rd
- 39 Damon Rd
- 19 Damon Rd
- 4 Damon Rd
- 51 Damon Rd
- 178 Brookwood Rd
Your Personal Tour Guide
Ask me questions while you tour the home.