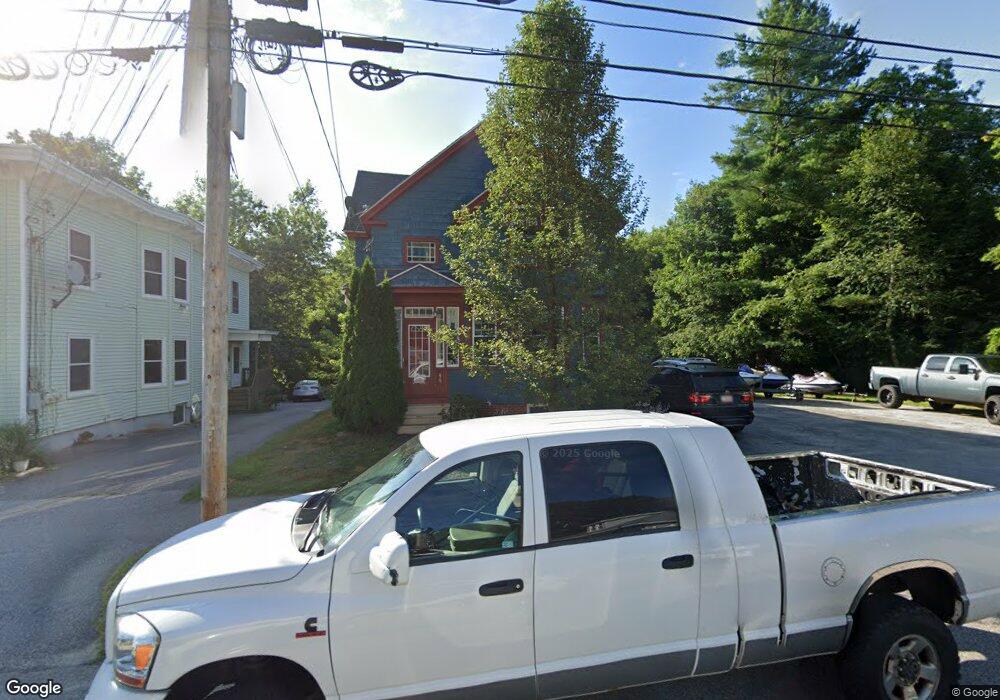
46 Davis Ave Auburn, ME 04210
Estimated Value: $385,820 - $482,000
6
Beds
3
Baths
3,482
Sq Ft
$123/Sq Ft
Est. Value
About This Home
This home is located at 46 Davis Ave, Auburn, ME 04210 and is currently estimated at $427,705, approximately $122 per square foot. 46 Davis Ave is a home located in Androscoggin County with nearby schools including Park Avenue Elementary School, Auburn Middle School, and Edward Little High School.
Ownership History
Date
Name
Owned For
Owner Type
Purchase Details
Closed on
Dec 16, 2024
Sold by
Henson Thomas G and Henson Diane J
Bought by
Mcbride Elijah M and Jordan Emory
Current Estimated Value
Home Financials for this Owner
Home Financials are based on the most recent Mortgage that was taken out on this home.
Original Mortgage
$311,400
Outstanding Balance
$308,634
Interest Rate
6.72%
Mortgage Type
Purchase Money Mortgage
Estimated Equity
$119,071
Purchase Details
Closed on
Apr 24, 2009
Sold by
Lagrange Norma M Est and Lagrange
Bought by
Henson Thomas G and Henson Diane J
Home Financials for this Owner
Home Financials are based on the most recent Mortgage that was taken out on this home.
Original Mortgage
$131,600
Interest Rate
4.93%
Mortgage Type
Purchase Money Mortgage
Create a Home Valuation Report for This Property
The Home Valuation Report is an in-depth analysis detailing your home's value as well as a comparison with similar homes in the area
Home Values in the Area
Average Home Value in this Area
Purchase History
| Date | Buyer | Sale Price | Title Company |
|---|---|---|---|
| Mcbride Elijah M | -- | None Available | |
| Mcbride Elijah M | -- | None Available | |
| Henson Thomas G | -- | -- | |
| Henson Thomas G | -- | -- | |
| Henson Thomas G | -- | -- |
Source: Public Records
Mortgage History
| Date | Status | Borrower | Loan Amount |
|---|---|---|---|
| Open | Mcbride Elijah M | $311,400 | |
| Closed | Mcbride Elijah M | $311,400 | |
| Previous Owner | Henson Thomas G | $131,600 |
Source: Public Records
Tax History Compared to Growth
Tax History
| Year | Tax Paid | Tax Assessment Tax Assessment Total Assessment is a certain percentage of the fair market value that is determined by local assessors to be the total taxable value of land and additions on the property. | Land | Improvement |
|---|---|---|---|---|
| 2024 | $5,046 | $226,800 | $42,700 | $184,100 |
| 2023 | $4,586 | $201,600 | $37,900 | $163,700 |
| 2022 | $3,822 | $168,000 | $31,600 | $136,400 |
| 2021 | $4,002 | $168,000 | $31,600 | $136,400 |
| 2020 | $3,893 | $163,900 | $31,600 | $132,300 |
| 2019 | $3,893 | $163,900 | $31,600 | $132,300 |
| 2018 | $3,881 | $163,900 | $31,600 | $132,300 |
| 2017 | $3,308 | $163,900 | $31,600 | $132,300 |
| 2016 | $3,663 | $163,900 | $31,600 | $132,300 |
| 2015 | $3,270 | $163,900 | $31,600 | $132,300 |
| 2013 | -- | $164,000 | $31,600 | $132,400 |
Source: Public Records
Map
Nearby Homes